Exploring Visualizations

Load Demo Data
CytoCanvas provides demo datasets that you can explore.
- Open the CytoCanvas application.
- Select Explore Demo Data.
- Identify the demo dataset that you want to explore, and then Select Open.
Load a Cell Dataset for Visualization
To load your cytoprofiling data in CytoCanvas for exploration, use one of the following methods:
- Load data from a local filesystem
- Load data from an Amazon S3 bucket
For both options, CytoCanvas first identifies the dataset through a cyto.viz manifest file.
Load Data Locally
- Open the CytoCanvas application.
- Select Open from files to browse the local filesystem.
- Navigate to the folder containing the
cyto.vizfile. - Select and open the
cyto.vizfile.
Load Data from Amazon S3
Data can be loaded directly from any Amazon S3 bucket.
Prerequisites
- For CytoCanvas versions 1.1.0-beta or higher, the user must have Amazon S3 storage credentials to this bucket with read access.
Load Data
- Identify the S3 URI location of the
cyto.vizfile (For example,s3://example_bucket-name/DemoInstrument/20240821_DemoInstrument_Example_Run/visualization/cyto.viz). - Open the CytoCanvas application.
- Select Open from Cloud.
- On the Load Data from AWS page, complete the following:
- Enter the S3 URI location to the
cyto.vizfile. - (Optional) Select Manage Credentials to create and store new AWS credentials or manage your existing AWS credentials.
- Enter the AWS Access Key ID.
- Enter the AWS Secret Key.
- (Optional) If you use temporary credentials, enter the AWS Session Token.
- Enter the AWS Region of the bucket, or select a region from the drop-down menu.
- Enter the S3 URI location to the
- Select Submit.
The visualization data loads and is ready to explore in CytoCanvas.
Visualization Types
Flow Cell View
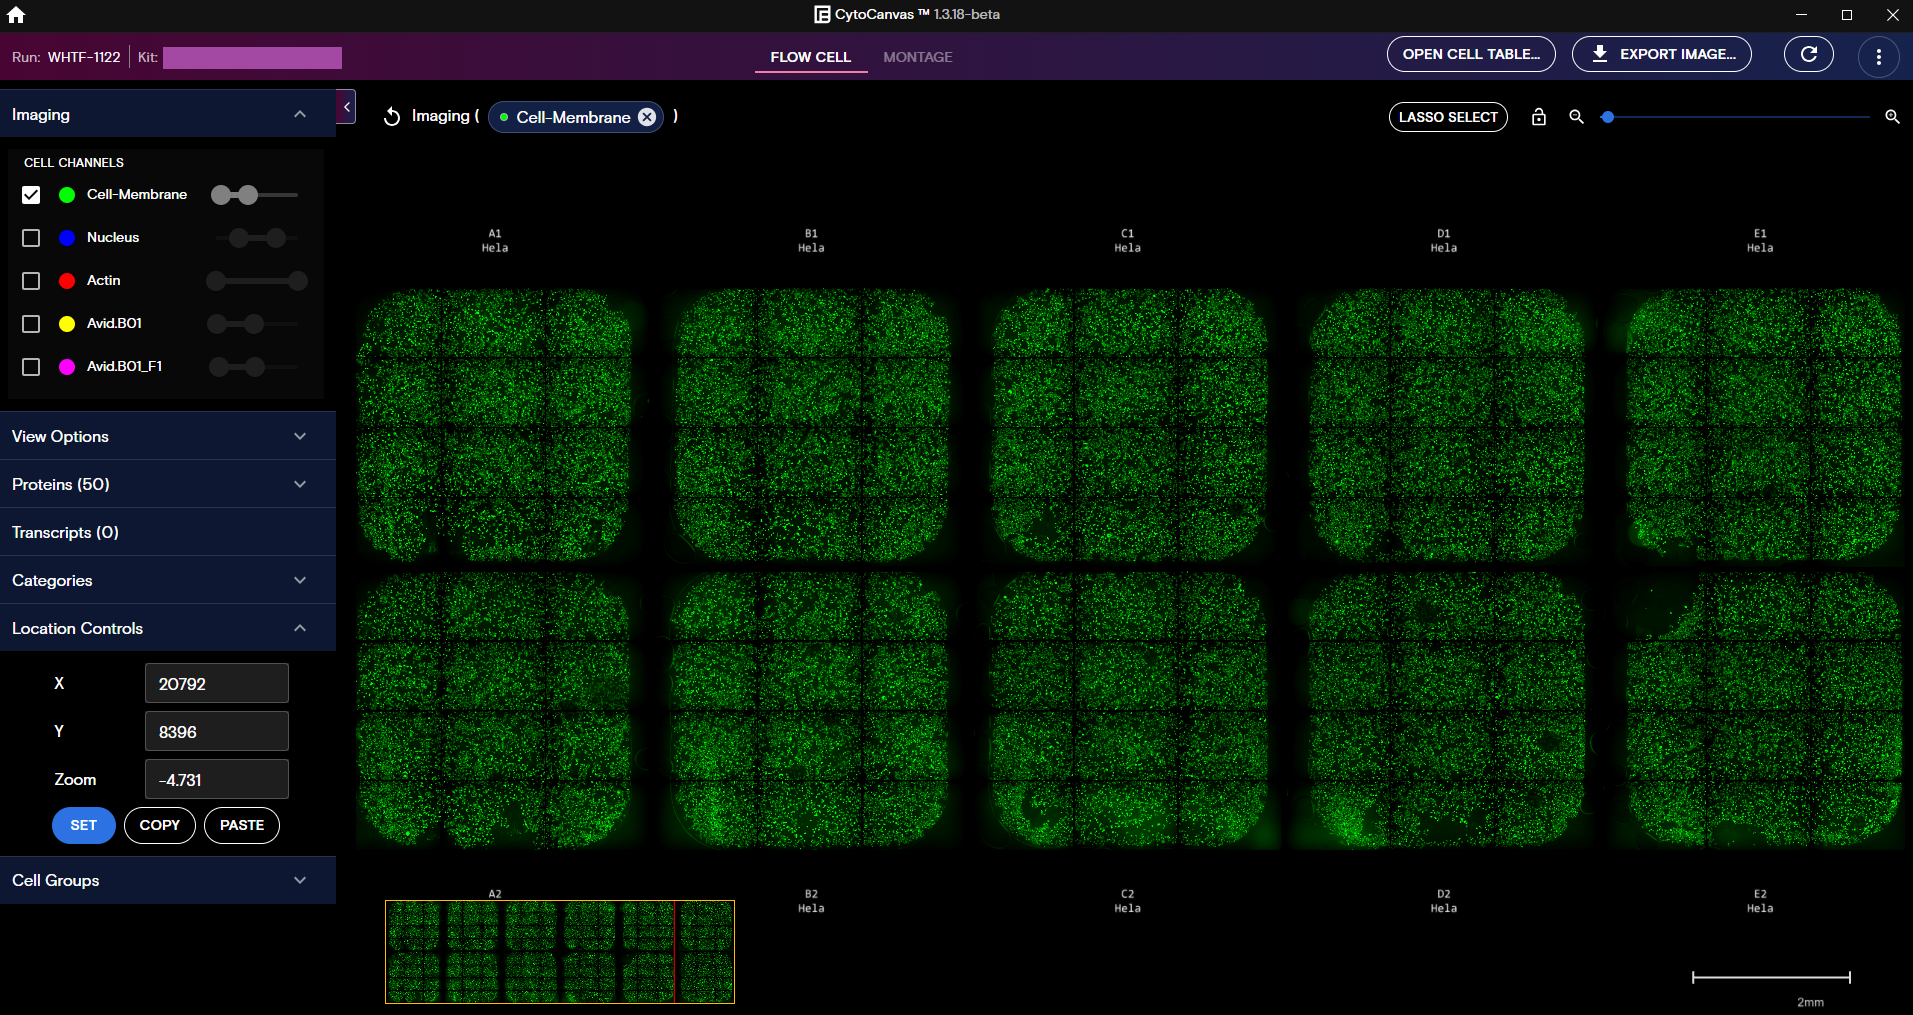
After the data is loaded, a visualization of the cell culture samples are displayed in Flow Cell view. In this view, each grid represents one of the wells on the flow cell for the run.
Flow Cell view includes the following features:
- Control the data types that appear by using the collapsible panels for Imaging, Proteins, and Transcripts.
- Zoom in and out of the target with the zoom bar in the viewport. To lock or unlock the zoom, toggle the lock icon next to the zoom bar.
- Enable visualization of Cell and Nuclear boundaries, manage the viewport features, and add well and tile labels that are visible while you pan the flow cell from the View Options panel.
- Visualize category data from
RawCellStats.parquetin the run directory. Categories are defined as any string grouping (for example, Gene, MostAbundantTarget, etc.). - Define an area of the flow cell to automatically add the associated cells to a new cell group with the Lasso Select tool. Cell groups made from the Lasso Select tool can contain more than 100 cells, but only the first 100 cells in the group are displayed in the Montage view.
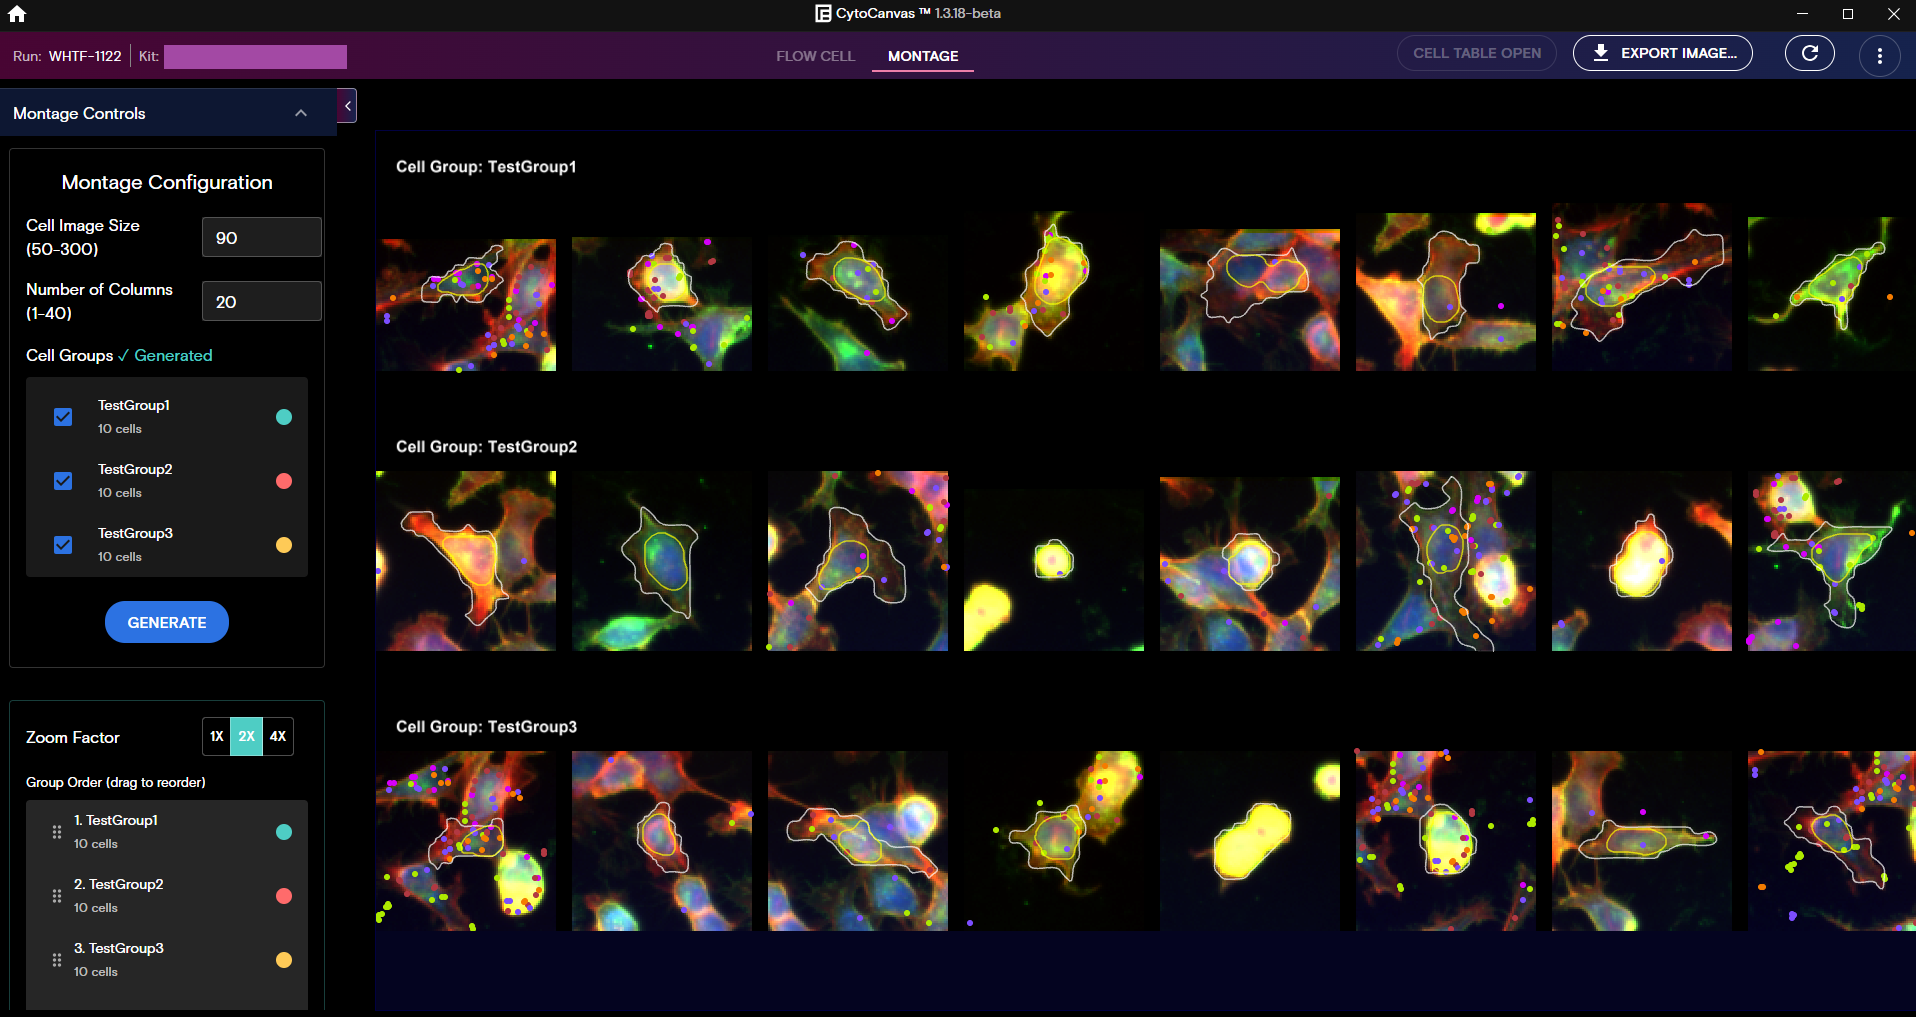
Montage View
Montage view includes the following features:
- Display cell groups and tile individual cell snapshots.
- Compare cells within a cell group or across cell groups.
- Use the Montage Controls panel to reorder groups, change image size, set the number of cells per column, and adjust the zoom level.
- Overlay morphology features, proteins, and transcript spatial locations.
- Visually focus on individual cells by removing the background to focus on intracellular proteins and reagents.
- Export Montage view images as needed.
Generate a Montage
To generate a montage, select the cell groups that you want to montage from the Montage Controls panel, and then select Generate. For more information on how to create cell groups, see Cell Table, Create a Cell Group using Lasso Select, and Create a Cell Group from the Cell Table.
Visualization Panels
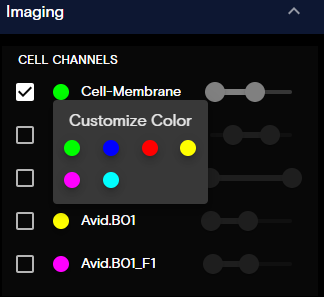
Imaging Panel
The Imaging panel contains toggles that control the visibility of cell features. Also, you can modify the appearance settings of the cell paint targets, such as:
- Target Visibility: To toggle the target visibility on or off, select or unselect the checkbox.
- Target Color: To customize the target color, select the color indicator circle, and then update the color.
- Color Contrast: To modify the target color contrast, set the [begin, end] values of the slider function for that cell channel.
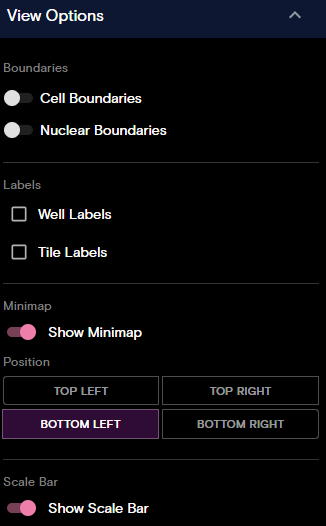
View Options Panel
The View Options panel allows you to control the following options:
- Boundaries: (Montage and Flow Cell view) Toggle cell boundaries and nuclear boundaries on or off. For Montage view, when you turn cell boundaries on, you can select to only show transcripts/proteins inside cells and mask image data outside cell boundaries.
- Labels: (Flow Cell view only) Toggle well labels and tile labels on or off.
- Minimap: (Flow Cell view only) Toggle the minimap on or off and set the position of the minimap.
- Scale Bar: (Flow Cell view only) Toggle the scale bar on or off.
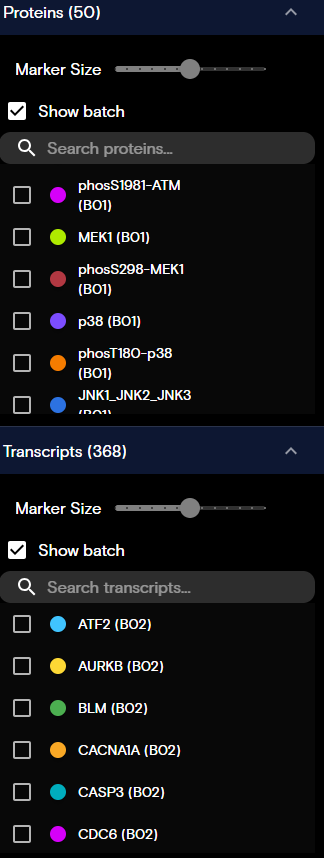
Proteins and Transcripts Panels
Dots on the visualization indicate the locations of the proteins and transcripts. The Proteins and Transcripts panels contain the following controls:
- Marker Size: Adjusts the size of the dots that are displayed in the view.
- Show batch: Toggles the associated batch name for proteins and transcripts.
- Search bar: Locates specific proteins and transcripts.
You can modify the appearance of protein and transcript targets as follows:
- Target Visibility: Toggles the protein or transcript visibility on or off.
- Target Color: To customize the protein or transcript color, select the color indicator circle, and then update the color.
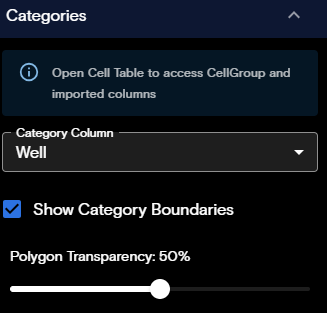
Categories Panel
The Categories panel is available from the Flow Cell view only. This panel provides visualization of cells based on categorical value columns from the Cell Table. Categorical values represent data from the RawCellStats.parquet that fall into distinct, named groups, rather than numeric measurements. The Categories panel includes the following controls:
- Category Column: Lists non-numeric type categories from the Cell Table columns.
- Show Category Boundaries: Toggles category boundaries on or off on the visualization.
- Polygon Transparency: Sets the polygon transparency level between 0-100%.
- Category Legend: Toggles the category boundaries per categorical value and allows setting the color of each value in the category. Appears on viewport after category boundaries are visualized.
Location Controls Panel
The Location Controls panel is available from the Flow Cell view only. This panel allows you to set, copy, or paste X and Y coordinates and the zoom level. The X and Y values can be found in the Cell Table for each cell.

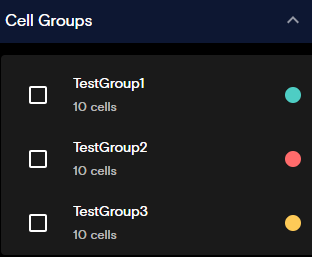
Cell Groups Panel
The Cell Groups panel is available from the Flow Cell view only. This panel allows you to toggle which cell groups you want to view. For more information on how to create cell groups, see Cell Table, Create a Cell Group using Lasso Select, and Create a Cell Group from the Cell Table.
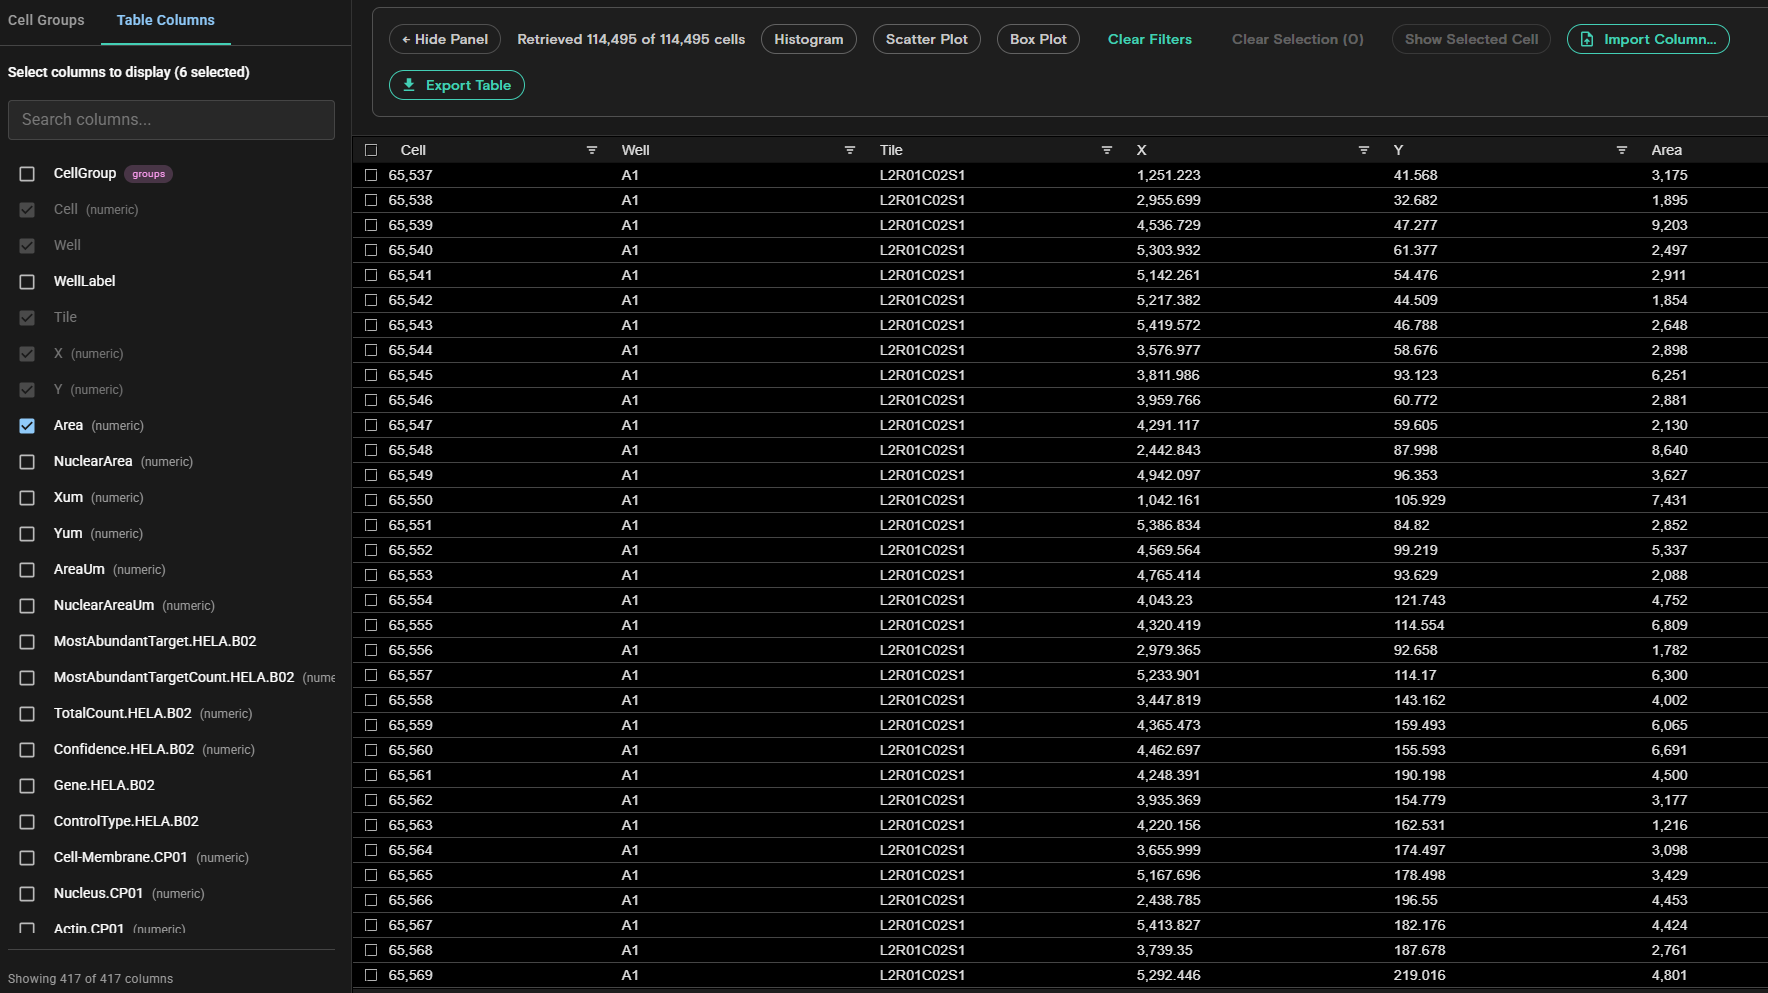
Cell Table
The Cell Table is available from Flow Cell or Montage view and allows you to manage cell groups. From the Cell Table, you can create a new cell group or edit, delete, and reorder existing cell groups. Any available data column in RawCellStats.parquet can be added to the Cell Table and new columns can be imported or removed from the Cell Table. You can also sort and filter each data column to select specific cells for display in Montage view. Cell groups can be exported from one run and imported into another run to share group definitions across collaborators and runs.
The Cell Table is only available when you generate visualizations with Cells2Stats v1.3.0 or later.
The Cell Table includes the following features:
- Cell Groups and Table Columns Panel: Allows you to manage Cell Groups and Table Columns.
- Cell Groups: If Cell Groups is selected, you can select a previously created cell group, edit or delete the selected cell group, and manage the cells in the group.
- Table Columns: If Table Columns is selected, you can select additional columns to display in the Cell Table. The default columns are
Cell,Well,WellLabel,Tile,X,Y, andArea. You can also search for specific columns if needed.
- Hide Panel or Show Panel: Allows you to hide or show the Cell Groups and Table Columns panel.
- Charts: You can create a histogram, scatter plot, or box plot that allow you to visualize cell data and filter cells in the Cell Table. Data available for each chart is based on the columns selected in the Cell Table. You can export box plot charts as images if desired.
- Export Table: Exports the Cell Table in
.csvformat. - Import Column from CSV: Allows you to add a custom column to your cell table. This is useful for bringing in external analysis results like clustering labels, classifications, or other computed values.
Create a Cell Group using Lasso Select
- From the Flow Cell view, select Lasso Select.
- Using the crosshair, draw an area on the flow cell of cells to select.
To deselect the area, draw a new area on the flow cell visualization or select Exit Lasso to exit the Lasso Select tool.
- Select Create Group From Selection.
- Enter a group name.
- (Optional) Provide a description of your cell group.
- (Optional) Select a group color.
- Select Create Group.
Create a Cell Group from the Cell Table
- From the Flow Cell or Montage view, select Open Cell Table.
- In the Cell Table, select the cells that you want to create a cell group for.
When you select a cell or group of cells, a prompt appears at the bottom of the screen that allows you to save the new cell group or add the selected cells to an existing cell group.
- Select Save as Cell Group.
- Enter a group name.
- (Optional) Provide a description of your cell group.
- Select Save.
Add Cells to a Cell Group
Up to 100 cells can be added to an individual cell group.
- From the Flow Cell or Montage view, select Open Cell Table.
- In the Cell Table, select the cells that you want to add to a cell group.
When you select a cell or group of cells, a prompt appears at the bottom of the screen that allows you to save the new cell group or add the selected cells to an existing cell group.
- From the Select group dropdown menu, select the cell group that you want to add the selected cells to.
- Select Add to Group.
Remove Cells from a Cell Group
- From the Flow Cell or Montage view, select Open Cell Table.
- From Cell Groups and Table Columns panel, select Cell Groups.
- Select the cell group that you want to remove cells from.
- Select the cells that you want to remove.
- Select Remove Selected Cells.
Edit the Cell Group Name, Color, and Description
- From the Flow Cell or Montage view, select Open Cell Table.
- From Cell Groups and Table Columns panel, select Cell Groups.
- Select the cell group that you want to edit, and select the Edit icon.
- Edit the cell group name, color, and description as desired.
- Select Save.
Delete a Cell Group
- From the Flow Cell or Montage view, select Open Cell Table.
- From Cell Groups and Table Columns panel, select Cell Groups.
- Select the cell group that you want to delete, and select the Trash icon.
When you select the Trash icon to delete a cell group, the cell group is immediately deleted. Make sure that you want to delete the cell group before you select the Trash icon.
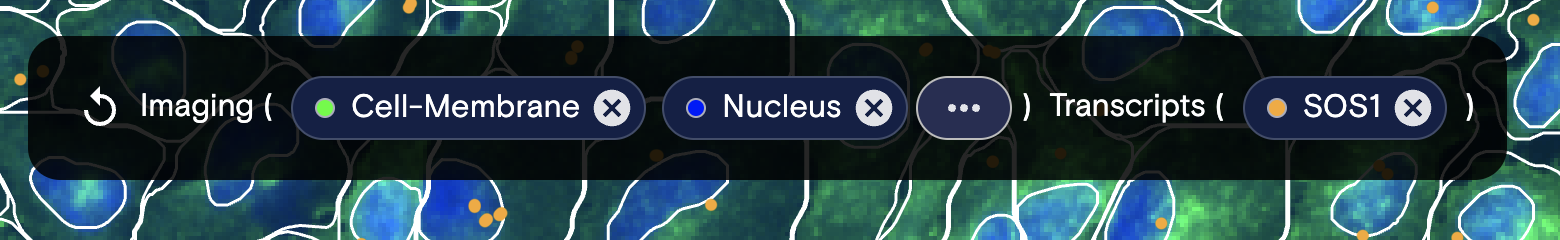
View and Undo Selections
Current selections are displayed in a bar at the top of the screen. To clear selections and revert to the default view, select the reverse arrow icon.
Export Image
To export the view on the screen as a JPEG, use the Export Image button. The exported image size is based on the size of the CytoCanvas desktop application window and will export only what is visible in the viewport.