Explore cytoprofiling visualizations
Learn how to load cytoprofiling data and use CytoCanvas™ visualizations to explore cells and spatial patterns. CytoCanvas supports loading data locally, directly from Amazon S3, or from Element-hosted demo datasets. Each dataset session is saved as a workspace, allowing you to resume your work exactly where you left off.
Workspaces
When you open a dataset in CytoCanvas, the application automatically creates a workspace alongside your data. A workspace captures your session state, including the loaded data source, view position, and any other session-specific settings. You can close CytoCanvas and reopen the workspace later to resume your session without reconfiguring your setup.
To reopen a saved session, open the workspace file from the home screen or from your filesystem instead of opening the cyto.viz file directly.
Load data for exploration
After selecting a data source (local files, Amazon S3, or demo data), CytoCanvas prompts you to complete two additional steps before opening the viewer:
- Name the workspace — enter a name for this session.
- Confirm the workspace save location — choose where the workspace file is saved on your local machine. The default location is your
Documents/CytoCanvas Workspacesfolder.
Load a cell dataset from a local filesystem
- Open the CytoCanvas application.
- Select Open from files to browse the local filesystem.
- Navigate to the folder containing the
cyto.vizfile. - Select and open the
cyto.vizfile. - Enter a name for the workspace and select Continue.
- Confirm or update the local save path for the workspace and select Open.
CytoCanvas loads the dataset and opens it in the viewer.
Load a cell dataset from Amazon S3
Data can be loaded directly from any Amazon S3 bucket using a saved credential profile. To create a credential profile before loading, see Manage AWS credential profiles.
- Open the CytoCanvas application.
- Select Open from Cloud.
- On the Load Data from AWS page, complete the following:
- Enter the S3 URI location to the
cyto.vizfile (for example,s3://example_bucket-name/DemoInstrument/20240821_DemoInstrument_Example_Run/SpatialData/cyto.viz). - Select a saved credential profile from the dropdown menu, or select Manage Credentials to add a new profile.
- Enter the S3 URI location to the
- Select Submit.
- Enter a name for the workspace and select Continue.
- Confirm or update the local save path for the workspace and select Open.
The visualization data loads and is ready to explore in CytoCanvas.
Load a demo dataset
Element Biosciences hosts demo cytoprofiling datasets that can be loaded directly from CytoCanvas without any credentials or local data files. Demo datasets are a quick way to explore CytoCanvas features using real Teton run data.
- Open the CytoCanvas application.
- Select Open Demo Data.
- Browse the available demo datasets and select one to load.
- Enter a name for the workspace and select Continue.
- Confirm or update the local save path for the workspace and select Open.
CytoCanvas downloads and loads the demo dataset and opens it in the viewer.
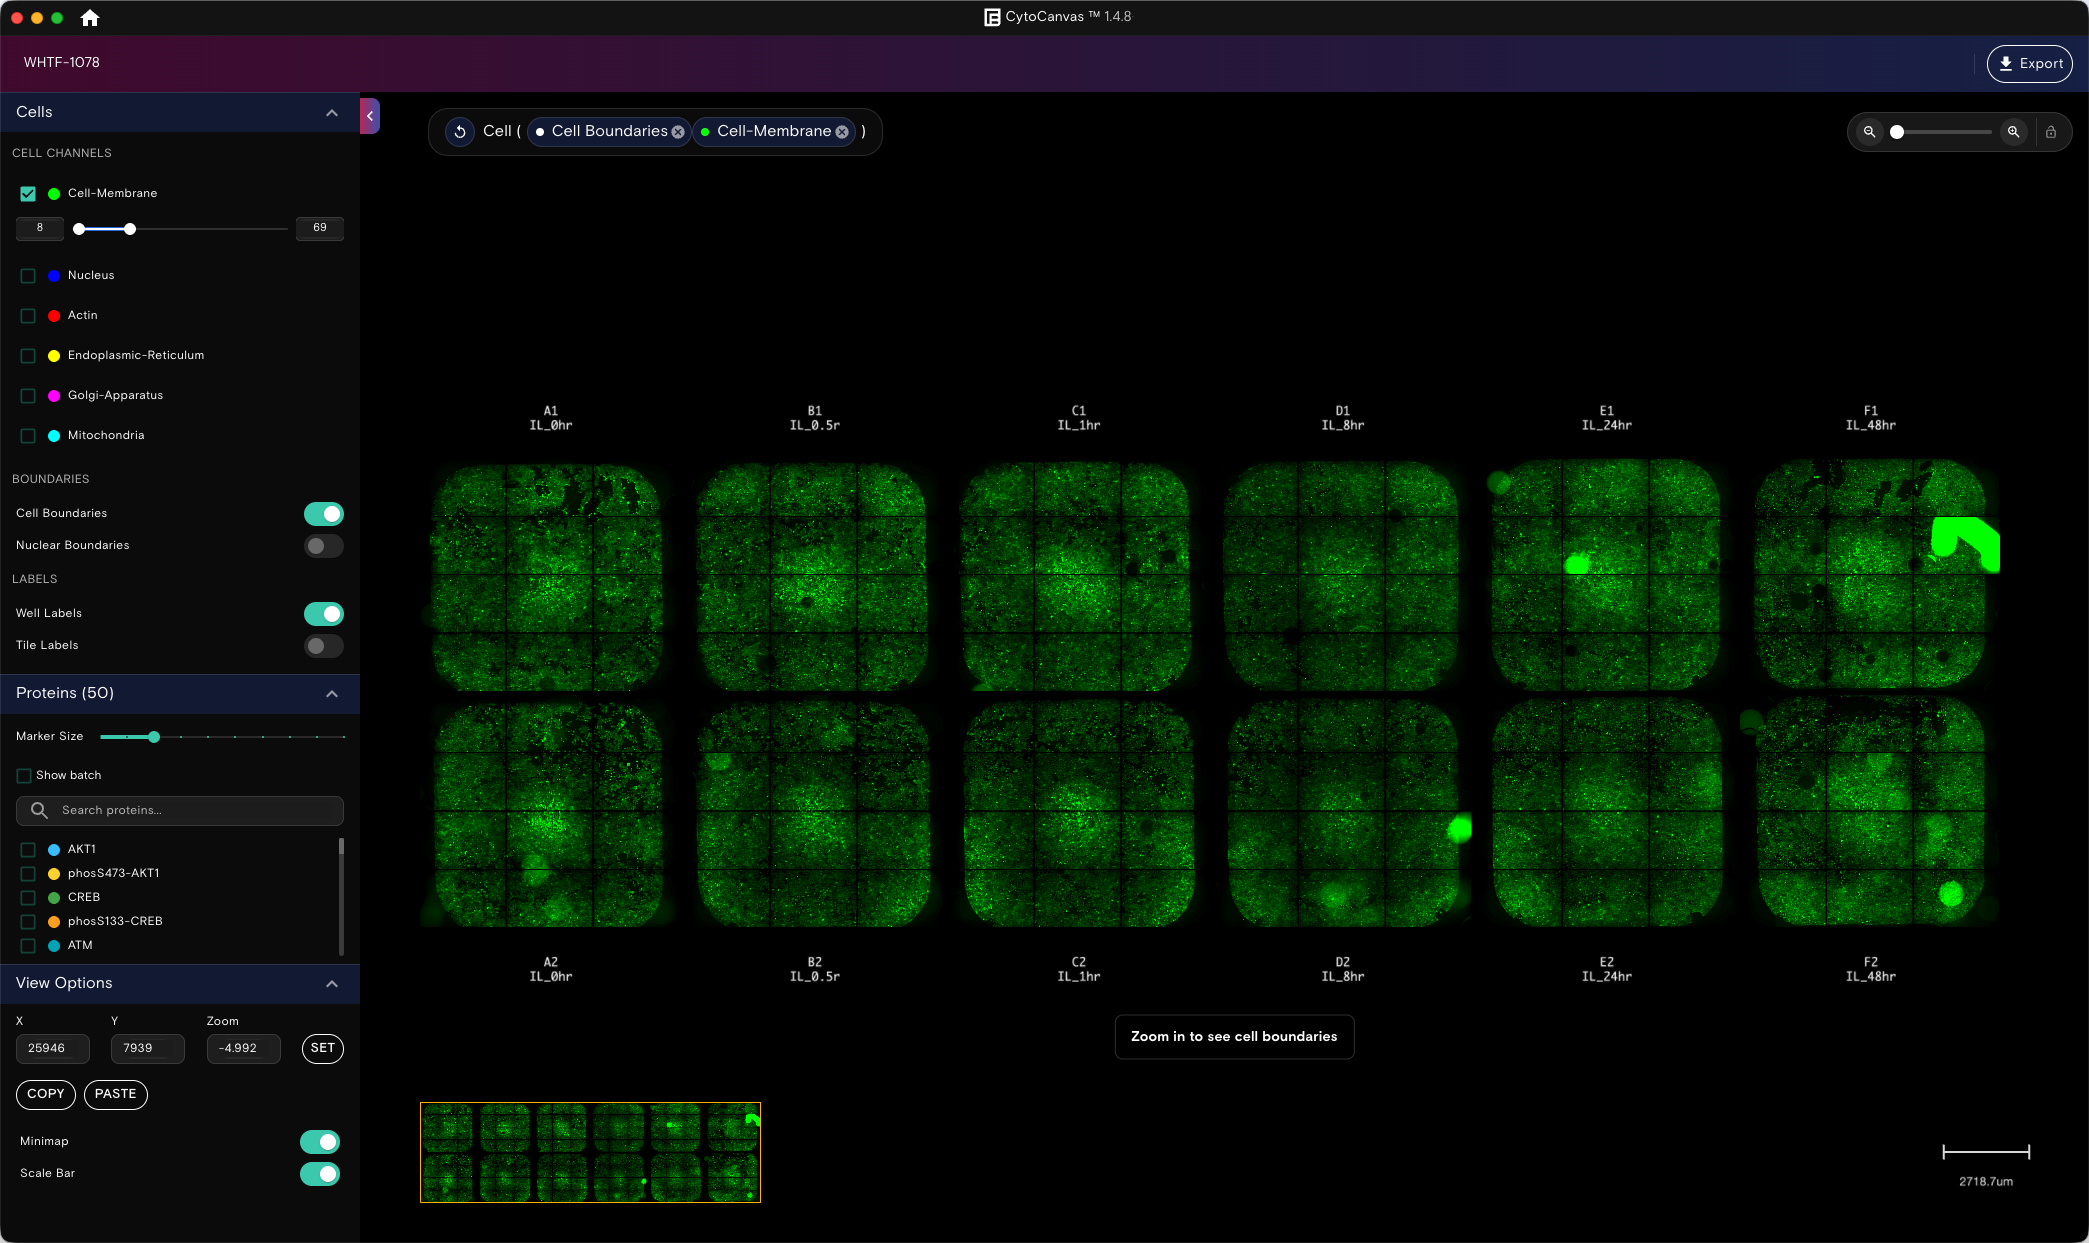
Explore the flow cell
Understand the flow cell view
Use the Flow Cell view to explore the overall layout of a cytoprofiling run, examine spatial patterns across wells, and identify regions or cells of interest.
In Flow Cell view, you can:
- Control the data types that appear by using the collapsible panels for Cells, Proteins, and Transcripts.
- Zoom in and out of the target with the zoom bar in the viewport. To lock or unlock the zoom, toggle the lock icon next to the zoom bar.
- Enable visualization of cell and nuclear boundaries and manage well and tile labels from the Cells panel of the flow cell view.
- Set, copy, or paste X and Y coordinates, control zoom level, and toggle the minimap and scale bar from the View Options panel.
For spatial data output from Cells2Stats, the Flow Cell view also renders transcript point locations and cell and nuclear boundary overlays at the full flow cell scale, using spatially-resolved data from the Cells2Stats parquet output.