Evaluating and applying alternate segmentation models
Learn how to select a new segmentation model and resegment an AVITI24 cytoprofiling run.
AVITI24™ cytoprofiling data is segmented as part of onboard processing during the run. After the run completes, examine your data in CytoCanvas™. If cell segmentation needs improvement, you can refine cell boundaries by resegmenting with an alternative Cellpose model and re-running Cells2Stats to regenerate the cell table against the new cell boundaries.

This tutorial covers model selection, tile-based evaluation, full segmentation, and cell assignment. An optional section covers running CellposeSAM (CPSAM) for cell types not represented in the Element Biosciences™ model library.
This tutorial references Cellpose and CPSAM, third-party tools that are not affiliated with, developed by, or supported by Element Biosciences. Element Biosciences makes no representations regarding their performance, reliability, or suitability and does not provide support for their use.
Pre-trained Element segmentation models
Element Biosciences provides Cellpose segmentation models pre-trained on AVITI24 cytoprofiling data. Models are bundled in the cytoprofiling package.
All Element model names include _15diam. Before segmentation, images are resized so that the expected cell diameter is 15 pixels. Cell-type-specific models set that diameter from training data. The general/other model uses the diameter you enter via the run manifest. A diameter that is too small can split cells into multiple masks. A diameter that is too large can miss cells or produce inaccurate boundaries.
Evaluate and select from pre-trained models
The selective tile evaluation notebook runs a few representative tiles through multiple candidate models in approximately 15 minutes, compares quality metrics side-by-side, and helps you select a model before committing to a full run. Choose a model that matches your cell type, then select the _2ch or _3ch variant for your run type to evaluate.
Choose segmentation models based on cell type
| Model Cell type | Notes |
|---|---|
| HeLa | Standard HeLa morphology. Compatible cell types: A549, U2OS. |
| HUVEC | Endothelial; elongated shape |
| MCF7 | Breast epithelial |
| PC3 | Prostate cancer. Compatible cell types: PC9. |
| HEK293 | General human cell line |
| Jurkat | Suspension T-cells; round morphology. Compatible cell types: Raji. |
| HepG2 | Hepatocellular carcinoma |
| HCT116 | Colorectal cancer |
| PBMC | Suspension cells; round morphology |
| SH-SY5Y | Neuroblastoma |
| Fibroblast | Mesenchymal; flat elongated morphology |
| iPSC | Induced pluripotent stem cells |
| General / Other | Fallback for unlisted cell types |
Choose segmentation models based on run type
The cytoprofiling run type determines which cell paint channels are imaged and which segmentation models are compatible with your data.
| Cell Paint only | Teton & Teton Atlas | |
|---|---|---|
| Kit Type | ||
| Channels imaged | Cell membrane, nucleus (2 channels) | Cell membrane, nucleus, actin (3 channels) |
| Compatible models | _2ch only | _3ch (recommended) or _2ch |
Set up the tile evaluation environment
-
Clone the cytoprofiling repository:
git clone https://github.com/Elembio/cytoprofiling.gitcd cytoprofiling -
Create the notebook Python environment. The
cytoprofilingpackage is installed from the local clone, and the notebook requires Cellpose3.0.7(do not update the version):python -m venv venvsource venv/bin/activatepip install ./src/pythonpip install cellpose==3.0.7 numpy==1.26.4 pandas==2.2.3 scikit-image==0.24.0 Pillow==10.4.0 ipywidgets==8.1.3 ipykernel==6.29.5 matplotlib==3.10.8 seaborn==0.13.2 jupyter==1.1.1 notebook==7.2.2python -m ipykernel install --user --name cytoprofiling-seg --display-name "Cytoprofiling Segmentation" -
Launch the notebook and switch the kernel to Cytoprofiling Segmentation (top menu → Kernel → Change kernel) so it runs against the venv you just configured:
jupyter notebook src/python/examples/segmentation_workbook/segmentation.ipynb
Run the evaluation
-
In the path-configuration cell, set the input and output path variables. The
run_directorymust contain aRunParameters.jsonfile and aProjection/subfolder with your.tifimages:# Path to your AVITI24 run output folderrun_directory = r"D:\YourRunFolder\20251108_AVXXXXX_RunName"# Where to write the segmentation mask outputs (must be a different folder)output_location = r"D:\YourRunFolder\Resegmentation_20251108" -
Run the well-and-tile-selection cell to launch the well and tile selection widget. The widget reads
RunParameters.jsonto detect your well layout (1-well, 12-well, or 48-well), displays a plate diagram, and presents multi-select dropdowns for wells and tiles.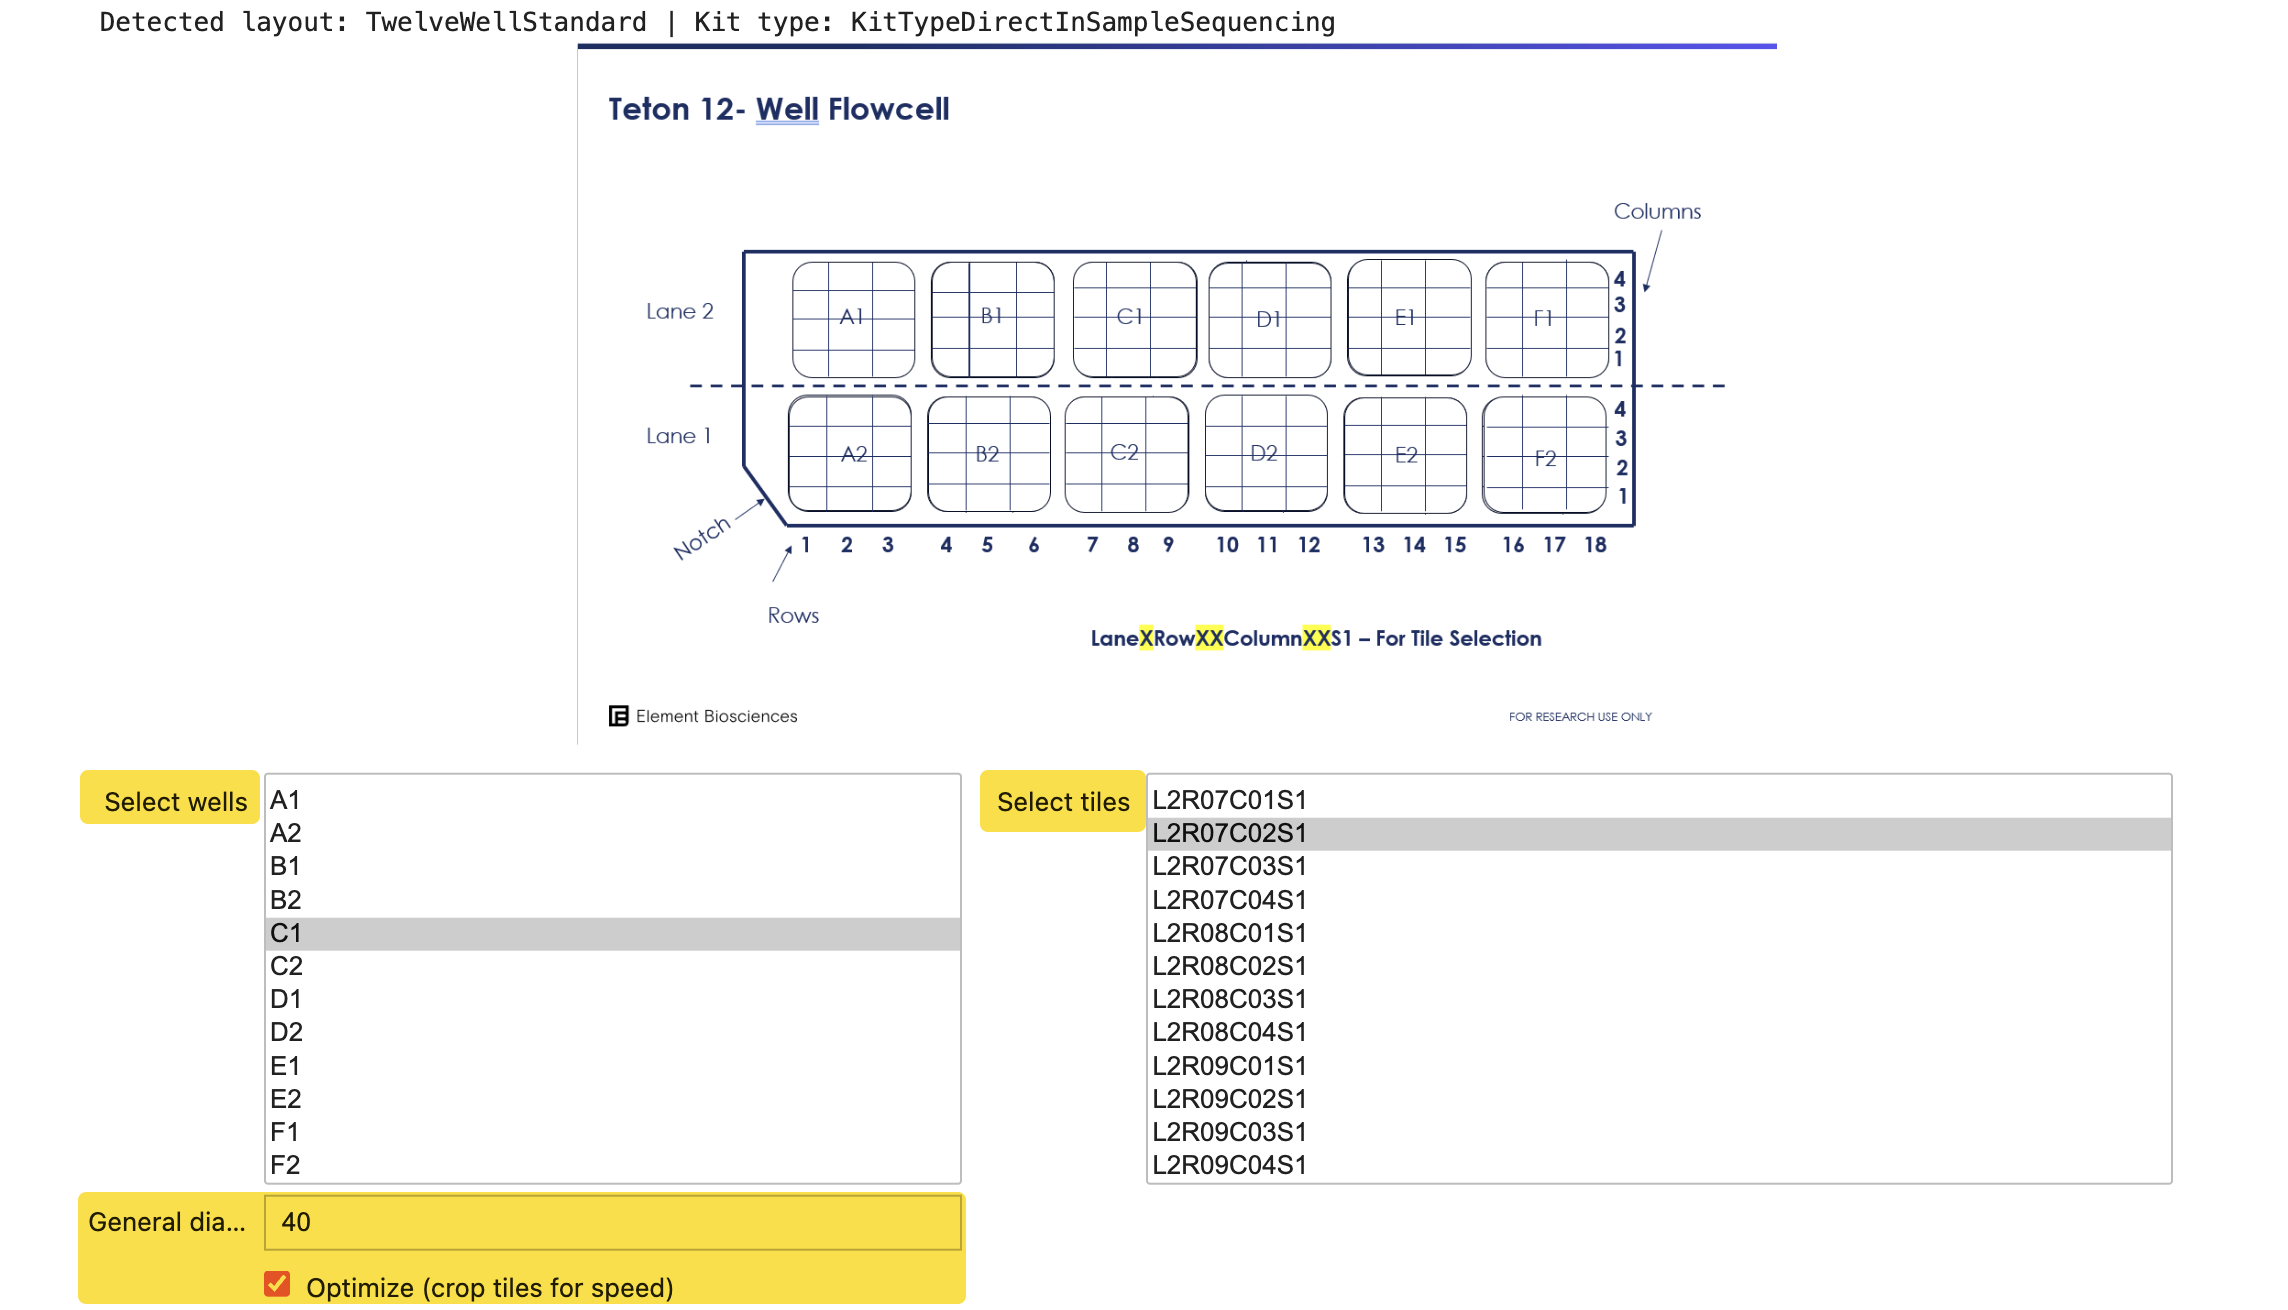
In the widget:
- Select 1–2 representative tiles from a single well for initial evaluation.
- Enter a cell diameter in pixels. Use approximately 40 px for most adherent cell lines, or approximately 25 px for small round suspension cells such as PBMC or Jurkat. To convert:
cell_diameter_µm = cell_diameter_px × 0.48 µm/px. - Select Optimize crop to reduce evaluation run time. Each AVITI24 tile is typically 3,648 × 5,472 pixels; Optimize crop crops each tile to a centered 1,824 × 1,824 region before segmentation.
- Select Confirm Selection.
-
Run the model-selection cell to launch the model selection widget. In the widget:
- Set
model_dirto your local path tocytoprofiling/src/segmentationModels. - Select one or more cell models to compare.
- Select the nuclear model
20250212_cellpose_nuc_8diam. - Select Confirm Models.
Note:The widget automatically filters to 2-channel models when it detects an optimization run. For Teton cytoprofiling runs, you can select either
_2chor_3chmodels. - Set
-
Run the evaluation cell. When complete, segmentation metrics and a thumbnail are displayed for each well, tile, and model combination.
Interpret results and choose a model
Assess each well, tile, and model combination using the metrics in the results table and the per-model summary charts.
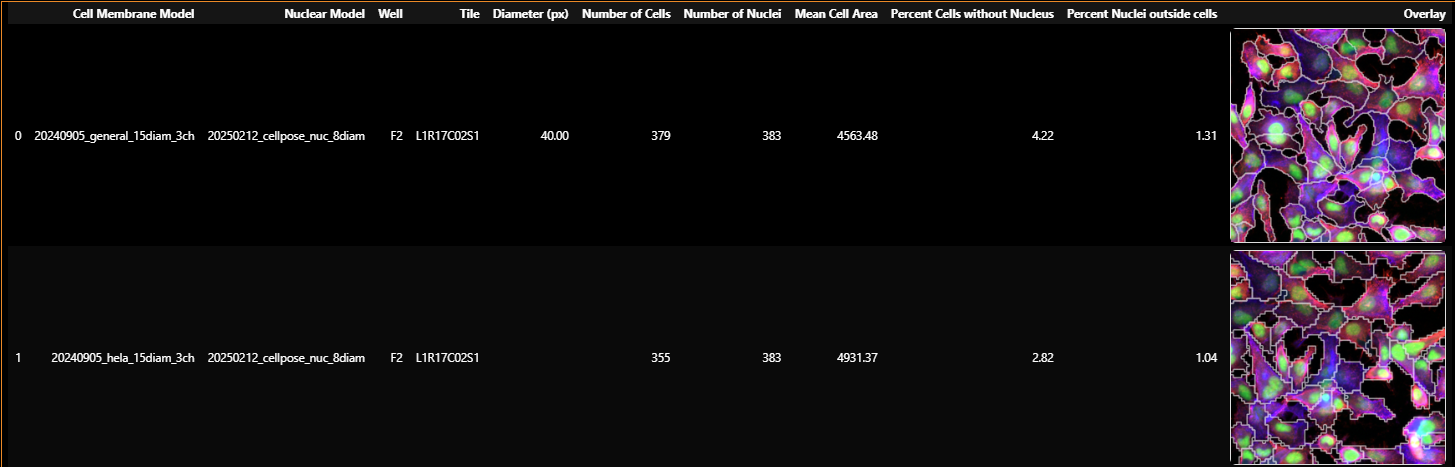
| Metric | What it means |
|---|---|
| Cell count | Total number of cell masks detected. A count that is dramatically too high or too low indicates a model mismatch. |
| Nucleus count | Total number of nuclei detected. A value not within 10-20% of the cell count likely indicates the segmentation model is not well-suited for this data |
| % Cells without nuclei | Percentage of cells where no nucleus is assigned. Values above 15% suggest over-segmentation of cells or under-segmentation of nuclei. Target: below 10%. |
| % Nuclei outside cells | Percentage of nuclei that fall outside any cell boundary. Values above 10% suggest under-segmentation of cells. Target: below 10%. |
| Mean cell area | Average pixel area per cell across all segmented cells in the tile. The value is a proxy for cell size, reported in pixel² units. |
| Segmentation thumbnail | A cropped image with cell borders in red, nuclei in green, and actin in light red (when available). Visually inspect whether borders align with actual cell edges. |
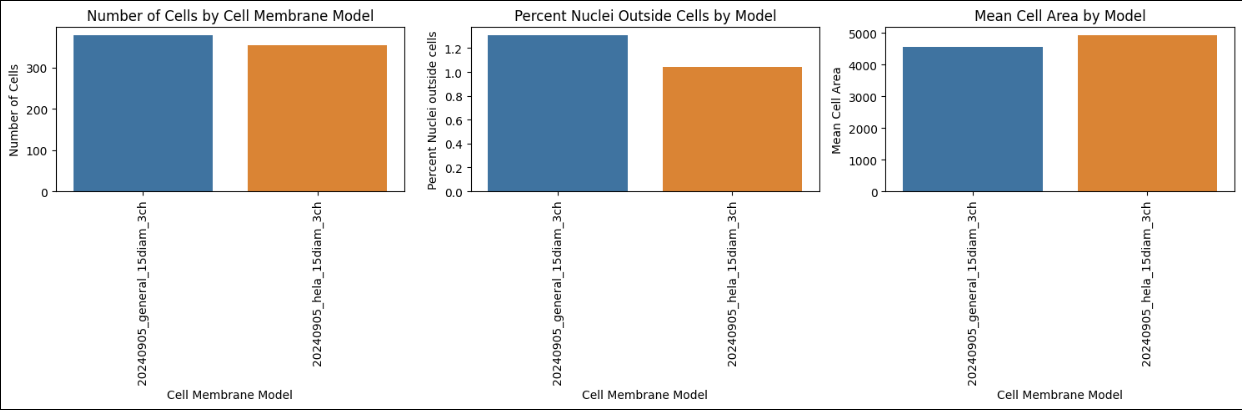
After you review the metrics, use the following decision framework to select a model to complete full resegmentation:
| What you see | Likely cause | Action |
|---|---|---|
| % Cells without nuclei > 15% | Over-segmentation: one cell split into multiple masks | Try the General model, or try a larger cell diameter |
| % Nuclei outside cells > 10% | Under-segmentation: cells merged or boundaries too tight | Try a cell-type-specific model, or try a smaller cell diameter |
| Cell count extremely high (2–3× expected) | Model treating debris or small regions as cells | Increase cell diameter; check the overlay thumbnail for debris |
| Cell count extremely low | Cells not detected; diameter too large or wrong model | Decrease cell diameter; try a different model |
| Both metrics within target and overlay looks clean | Good segmentation | Record the model name and proceed to run full segmentation |
| Multiple models perform similarly | Either is acceptable | Prefer the cell-type-specific model for production use |
| No Element model meets the targets | Cell type or imaging conditions not represented well | Proceed to Run CellposeSAM segmentation for other cell types |
Once a model meets these targets, record its name and proceed to Run full segmentation.
Run full segmentation
The full segmentation notebook applies selected per-well models to every tile in the run and writes the segmentation masks Cells2Stats expects as input. The notebook auto-detects your plate layout from RunManifest.csv and assigns models per well based on the Run Manifest input. Adjust well assigned models based on the model comparison evaluation.
If you already set up your environment during tile evaluation, your clone and cytoprofiling-seg venv are reusable. Activate the venv and skip to step 3.
-
Clone the cytoprofiling repository:
git clone https://github.com/Elembio/cytoprofiling.gitcd cytoprofiling -
Create the notebook Python environment. The
cytoprofilingpackage is installed from the local clone, and the notebook requires Cellpose3.0.7(do not update the version):python -m venv venvsource venv/bin/activatepip install ./src/pythonpip install cellpose==3.0.7 numpy==1.26.4 pandas==2.2.3 scikit-image==0.24.0 Pillow==10.4.0 ipywidgets==8.1.3 ipykernel==6.29.5 matplotlib==3.10.8 seaborn==0.13.2 jupyter==1.1.1 notebook==7.2.2python -m ipykernel install --user --name cytoprofiling-seg --display-name "Cytoprofiling Segmentation" -
Launch the notebook and switch the kernel to Cytoprofiling Segmentation (top menu → Kernel → Change kernel) so it runs against the venv you just configured:
jupyter notebook src/python/examples/segmentation_workbook/full_segmentation.ipynb
Configure paths and review cell-type assignments
In the notebook, Steps 1 through 3 prepare the run; nothing is segmented until Step 6.
If the run_directory does not contain RunManifest.csv, the notebook falls back to RunParameters.json, lists every well, and assigns each one to OTHER. Use STEP B in Step 3 to set cell types manually for those wells.
-
Run Step 1 — Import packages to load packages.
-
Run Step 2 — Provide Input and Output Paths. Do not forget to update to your local paths.
- The run directory must contain
RunParameters.json,RunManifest.csv, and aProjection/subfolder with channel.tifimages. - If you developed a CPSAM model, ensure the path is accurate.
# Path to your AVITI24 run output folderrun_directory = r"/path/to/your/Run/Output/Folder"# Where to write the segmentation mask outputs (must be a different folder)output_location = r"/path/to/your/Run/Output/Folder/Segmentation_Output"# Path to segmentation modelsmodel_dir = r"/path/to/cytoprofiling/src/segmentationModels" - The run directory must contain
-
Run Step 3 — Configure cell types and models. The cell auto-loads cell types from the run manifest in three substeps:
- STEP A pre-loads the
[Wells]section ofRunManifest.csvand prints the loadedcell_typesandcell_diameters. - Use STEP B to override a well's cell type or use a different model for a specific well. Diameters set here apply only to wells whose cell type is
OTHER. - STEP C lists the segmentation model file for each cell type. The defaults use
_3chmodels for Teton and Teton Atlas runs. For Cell Paint only runs, change every model name from_3chto_2ch.
- STEP A pre-loads the
After paths are set and cell-type assignments look correct, run the remaining cells in order to produce the masks.
-
Run Step 4 — Define normalization and segmentation helpers to register the per-tile helper functions used by the segmentation loop.
-
Run Step 5 — Build the tile list from
RunParameters.json. The notebook printsTotal tiles to process: {N}so you can confirm the workload before committing to Step 6. -
Run Step 6 — Segment every tile and write masks. To monitor progress, watch for the rolling
Finished segmenting ...lines.
Runtime expectations
Full segmentation processes every tile in the run. Approximate run times are as follows:
| Flowcell | Tiles | CPU estimate | GPU estimate |
|---|---|---|---|
| 1-well | 231 | ~5 days | ~8 hours |
| 12-well | 144 | ~3 days | ~5 hours |
| 48-well | 96 | ~2 days | ~3.5 hours |
Output files
For each tile, the notebook writes a nuclear and cell segmentation mask.
{output location}
└── WellC1 ... for n wells
    ├── L2R07C02S1_Cell.tif ... for n tiles
    └── L2R07C02S1_Nuclear.tif ... for n tiles
After all tiles finish, re-run Cells2Stats for cell assignment to regenerate the cell table with your new masks.
Run CellposeSAM segmentation for other cell types
CellposeSAM (CPSAM) is a newer Cellpose model that integrates the Segment Anything Model (SAM) architecture. CPSAM is a general-purpose model and is not specifically trained on AVITI24 cytoprofiling data, but it can produce strong results on cell types Element has not validated a model for and imaging conditions not represented in the Element model library.
CPSAM requires a GPU. CPSAM on CPU is prohibitively slow for full-run processing.
Consider CPSAM when any of the following applies:
- You have confirmed your cell type is not well-segmented by any of the pre-trained Element models by running a tile evaluation.
- The general Element model produces poor results even after diameter tuning.
- You want to compare CPSAM with your best Element model.
CellposeSAM is provided by the MouseLand open-source project and is not affiliated with or endorsed by Element Biosciences. Element pre-trained models were developed and validated on AVITI24 cytoprofiling data. CPSAM has not been formally validated against AVITI24 cytoprofiling runs and results may vary. For CPSAM-specific issues, installation support, or model updates, refer to the official MouseLand repository.
CPSAM compared to Element Biosciences models
| Aspect | Element Biosciences custom models | CellposeSAM (CPSAM) |
|---|---|---|
| Training data | AVITI24 cytoprofiling images | General microscopy (broad) |
| Cellpose version | 3.x (3.0.7 recommended) | 4.x (4.0.8+) — required |
| Python environment | cytoprofiling-seg (shared with the tile evaluation notebook) | Separate cpsam environment |
| Model download | Bundled in the cytoprofiling package | Auto-downloads ~1.15 GB from MouseLand on first run |
| GPU requirement | Optional (CPU is slow but functional) | GPU strongly recommended |
| Multi-well config | Per-well cell type and diameter mapping | Single model; no cell-type config needed |
| Channel support | 2-channel or 3-channel depending on the model | Cell membrane and nucleus; actin optional |
Run CPSAM segmentation
The CPSAM segmentation notebook (cpsam_segmentation.ipynb) applies CPSAM to every tile in the run and writes the segmentation masks Cells2Stats expects.
CPSAM does not produce a built-in quality metrics table. Verify outputs visually or by comparing cell and nucleus counts against the baseline established in interpret results and choose a model.
Set up the CPSAM environment
-
Clone the cytoprofiling repository:
git clone https://github.com/Elembio/cytoprofiling.gitcd cytoprofiling -
Create the CPSAM notebook Python environment. CPSAM uses Cellpose 4.x, which is not compatible with the Cellpose 3.0.7 environment used by the tile evaluation and full segmentation notebooks. Do not install Cellpose 4.x into your existing
cytoprofiling-segvenv.python -m venv venv_cpsamsource venv_cpsam/bin/activate# Switch for Windows# venv_cpsam\Scripts\activate# Install Cellpose from the latest GitHub HEAD (includes CPSAM)pip install "git+https://github.com/mouseland/cellpose.git"pip install scikit-image numpy ipykernel jupyter notebookpython -m ipykernel install --user --name cpsam --display-name "CellposeSAM" -
Launch the notebook and switch the kernel to CellposeSAM (top menu → Kernel → Change kernel) so it runs against the venv you just configured:
jupyter notebook src/python/examples/segmentation_workbook/cpsam_segmentation.ipynb
Configure paths and load the model
Steps 1 through 3 import packages, set the input and output paths, and load the CPSAM model. Nothing is segmented yet.
-
Run Step 1 — Import packages to load packages.
-
Run Step 2 — Provide Input and Output Paths. Do not forget to update to your local paths.
- The run directory must contain
RunParameters.jsonand aProjection/subfolder withCell-MembraneandNucleus.tifimages. IncludeActinimages when available. - Use a fresh
output_locationso CPSAM masks do not overwrite your original run masks.
# Path to your AVITI24 run output folderrun_directory = r"/path/to/your/Run/Output/Folder"# Where to write the CPSAM segmentation mask outputs (must be a different folder)output_location = r"/path/to/YourRunFolder/Resegmentation_folder" - The run directory must contain
-
Run Step 3 — Confirm GPU and load CPSAM. The cell prints
GPU confirmed. Proceeding with CPSAM segmentation.when a GPU is available, then loads the model.
The first time you initialize the CPSAM model, Cellpose downloads the model weights (~1.15 GB) from HuggingFace to ~/.cellpose/models/. Subsequent runs use the cached weights and do not require an internet connection.
Run the segmentation
After paths are set and the model is loaded, run the notebook Steps 4 through 6 in to produce the cell boundaries as segmentation masks.
-
Run Step 4 — Define the normalization helper to register the per-region normalization function used by the segmentation loop.
-
Run Step 5 — Build the tile list from
RunParameters.json. The notebook printsTotal tiles to process: {N}so you can confirm the workload before committing to Step 6. -
Run Step 6 — Segment every tile and write masks. The cell prints
Beginning segmentation across {N} tilesimmediately. To monitor progress, watch for the rollingDone: ...lines.
After all tiles finish, proceed to re-run Cells2Stats for cell assignment with the CPSAM masks applied.
Runtime expectations
CPSAM processes every tile in the run. CPU runtimes are prohibitive; the table below assumes a GPU.
| Flowcell | Tiles | GPU estimate |
|---|---|---|
| 1-well | 231 | ~8 hours |
| 12-well | 144 | ~5 hours |
| 48-well | 96 | ~3.5 hours |
Output files
For each tile, the notebook writes a nuclear and cell segmentation mask to output_location/Well{well}/:
{tile}_Cell.tif: auint16label mask where each unique integer represents one segmented cell.{tile}_Nuclear.tif: auint8binary mask where0indicates no nucleus and1indicates a nucleus is present.
Re-run Cells2Stats for cell assignment
After all tiles are processed, run Cells2Stats with the --segmentation argument, passing in the newly generated segmentation masks, to re-assign targets and regenerate the cell table data according to the updated segmentation.
cells2stats /path/to/run --segmentation /path/to/Output/CellSegmentation --output /path/to/Cells2Stats_Output
For more information, see the Cells2Stats documentation and the alternative cell segmentation directory format.
Troubleshooting
Use the following guidance to help with errors encountered running any of the segmentation notebooks.
| Error or symptom | Cause | Fix |
|---|---|---|
AttributeError: 'NoneType' object has no attribute 'shape' | Actin .tif could not be read, likely a Cell Paint only run with a 3-channel model | Switch to a _2ch model. Cell Paint only runs do not have an actin file. |
FileNotFoundError: RunParameters.json not found | run_directory path is incorrect or the folder is not a valid AVITI24 run output | Verify the path. The folder must contain RunParameters.json at its root. |
ValueError: No models found in model_dir | model_dir path is incorrect or the cytoprofiling package is not installed at that location | Reinstall cytoprofiling and confirm the path to the segmentationModels/ directory. |
| Model loads but produces 0 cells | Cell diameter is too large, or model is wrong for the cell type | Reduce the diameter in the widget. Try the General model. |
| Cell count unreasonably high (10× expected) | Debris, cell fragments, or a very small cell diameter | Increase the diameter. Inspect the normalize_image output for noise. |
ImportError: No GPU access, change your runtime | No GPU detected by PyTorch (CPSAM notebook) | Install CUDA-enabled PyTorch, or proceed on CPU and accept long runtimes. |
| Cellpose version mismatch errors | Wrong Cellpose version in the active environment | Deactivate and activate the correct named environment (cytoprofiling-seg versus cpsam). |
| Widget does not render in the notebook | ipywidgets is not installed or the wrong kernel is selected | Confirm ipywidgets==8.1.3 is installed and the Cytoprofiling Segmentation kernel is active. |