Overview
CytoCanvas Studio™ is a cloud-based visualization application for exploring and analyzing AVITI24™ Teton™ multiomic cytoprofiling data.
Overview
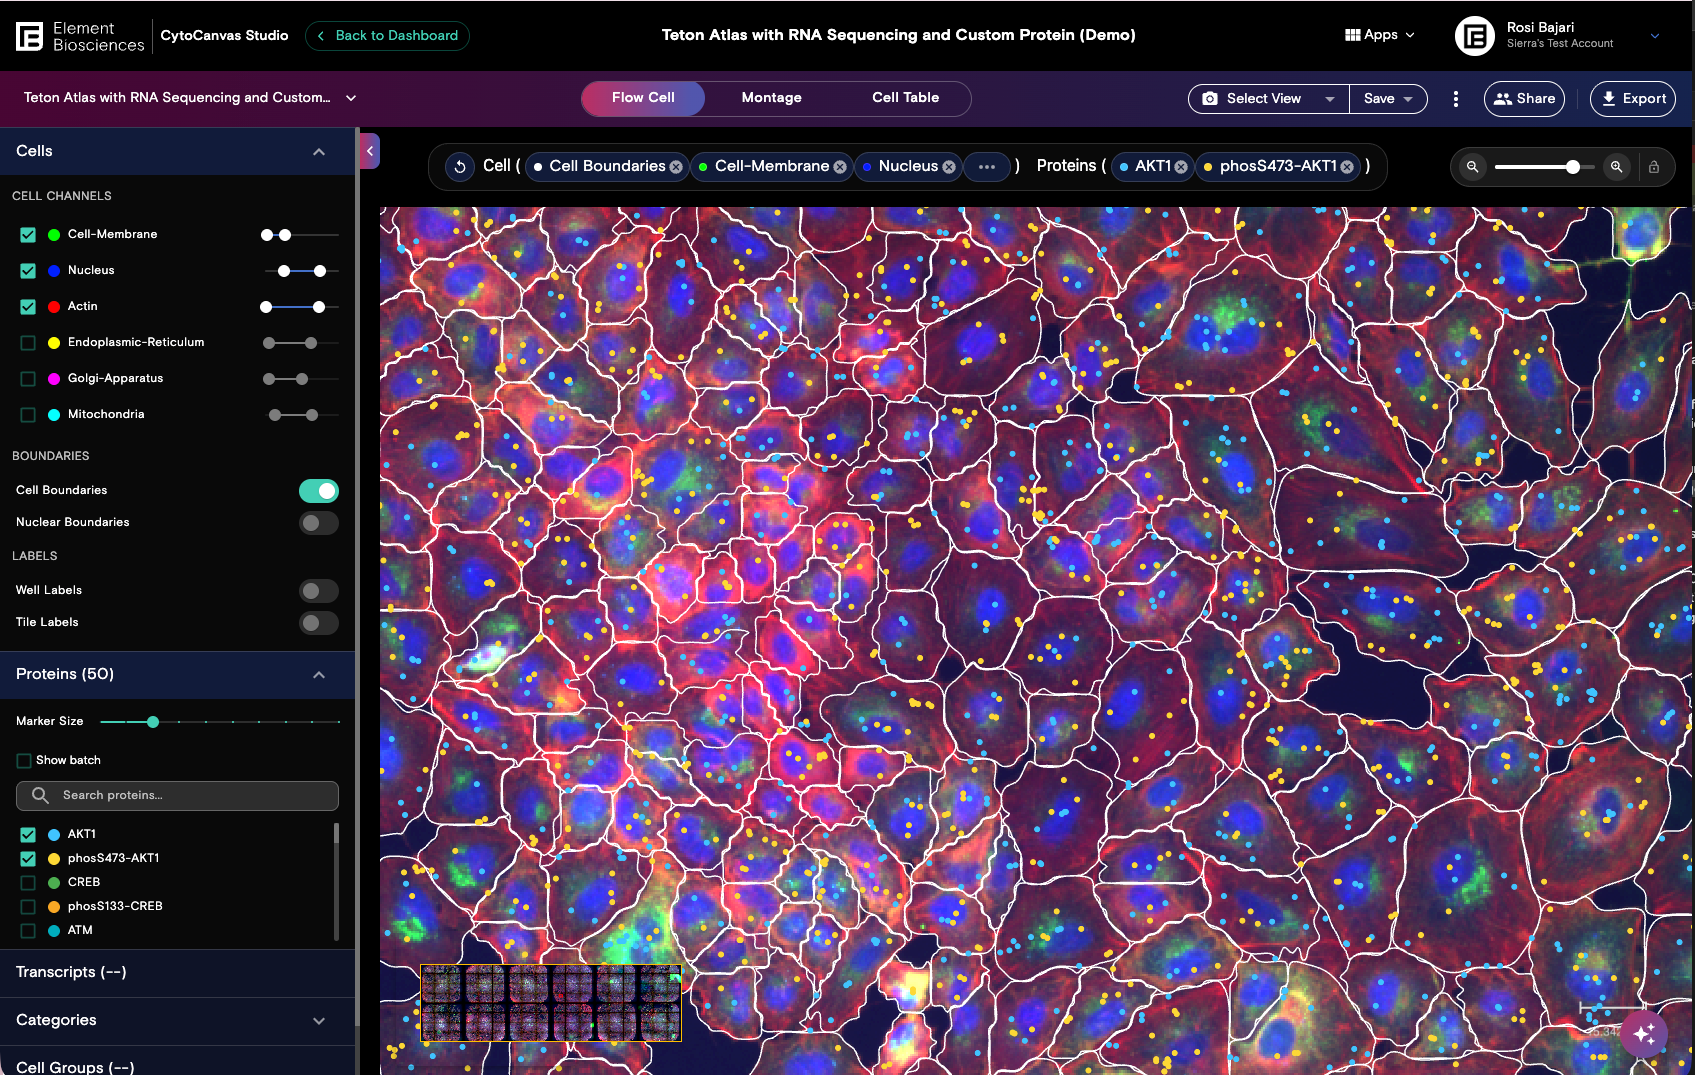
CytoCanvas Studio™ allows you to explore interactive single-cell visualization of AVITI24™ Teton™ multiomic data, including proteins, phospho-proteins, and RNA transcripts. It serves as the primary gateway for post-run visual quality control and interactive multi-omic analysis, letting you confirm accurate cell segmentation, map molecular activity across your sample, and share findings with your team, all from a web browser.
Key capabilities
- Verify run quality: Overlay segmentation masks onto raw fluorescence images to confirm cells were correctly identified.
- Explore multi-omic layers: Toggle RNA transcripts, localized proteins, phospho-proteins, and organelle markers as individual channels directly onto high-resolution cell images to see where molecular activity occurs within clearly delineated cell boundaries.
- Organize and revisit visualizations: Save named views that capture applied morphology channels cellular markers.
- Share curated views with your team or collaborators: Share canvases organization-wide or generate links for quick read-only access to a visualization without requiring a login.
Data analysis pipeline with CytoCanvas
CytoCanvas Studio fits into a fully automated post-run workflow, from instrument to insight.
- Automated data upload: Teton run data is securely uploaded automatically to your ElemBio Catalyst or AWS account.
- Pipeline processing: A Cells2Stats pipeline triggers automatically upon run complete, generating visualization files from run data.
- Visual QC: Open CytoCanvas Studio to overlay segmentation masks onto raw fluorescence images and verify that cell boundaries are accurate before committing to downstream analysis.
- Interactive multi-omic discovery: Explore your validated data using data filters, cell groups, plots, and multi-layered visualizations to map molecular activity within its spatial context.
CytoCanvas Studio versus CytoCanvas Desktop
CytoCanvas is available in two forms. Choose based on your lab's infrastructure and access requirements.
| CytoCanvas Studio | CytoCanvas Desktop | |
|---|---|---|
| Primary use | Cloud-integrated QC and analysis | Local access without cloud dependency |
| Accessibility | Any supported web browser (Mac, PC, tablet) | Local installation (Windows, macOS, Linux) |
| Data source | ElemBio Catalyst™ or AWS S3 | Local drives, AWS S3, or network storage |
| Key advantage | No installation; instant access from anywhere | For customers who cannot access the cloud |
| Collaboration | Share canvases via organization links or external read-only links | Export and share visualization manually |
Access CytoCanvas Studio
CytoCanvas Studio uses your ElemBio Cloud credentials for authentication. Each organization has a dedicated URL.
- Navigate to
https://{orgname}.cytocanvas.elembio.io, where{orgname}is your ElemBio Cloud organization name. - Log in with your ElemBio Cloud credentials.
After authentication, CytoCanvas Studio redirects to the Dashboard where you can create, manage, and open canvases.
You can also open CytoCanvas Studio directly from ElemBio Cloud for cytoprofiling runs that are cloud-enabled through ElemBio Catalyst or AWS storage connections.
- From the run details page, select the link to open the run in CytoCanvas Studio.
- From the data browser, select the
View in CytoCanvasbutton from any directory containing acyto.vizfile.
Browser compatibility
The following web browsers support CytoCanvas Studio:
- Chrome (recommended)
- Firefox