Analyzing an optical pooled CRISPR screen
Compare knockout and control cells across RNA, morphology, and protein readouts from one pooled CRISPR screen.
An optical pooled screen (OPS) on AVITI24™ with Cytos™ reads each cell's CRISPR guide alongside its 3′ RNA, CellPaint morphology, and protein immunofluorescence (IF). This tutorial walks through a public TGFBR2 knockout × TNFα screen and shows the key steps. The complete, runnable code is in the OPS CRISPR case-study notebook.
Before you begin
- Install the multiomics Python package and JupyterLab. The install includes PyDESeq2, statsmodels, and umap-learn, which this tutorial uses.
- Review the Spatial Data Object (SDO) format.
- The tutorial streams the public Cytos-MPS_TNFa-CRISPR-Screen example dataset from Amazon S3, so you do not need to download it or provide AWS credentials. To work from a local copy instead, use the download commands in the first section of the OPS CRISPR case-study notebook.
Experiment design
HeLa cells carry a pooled Cellecta guide library, so every well mixes knockout and non-targeting (NT) cells. The plate has 12 wells:
WellLabel | Condition | Wells |
|---|---|---|
Cellecta | Untreated | 6 |
CellectaTNFa | 30 minutes of TNFα | 6 |
The knockout comparisons use the six untreated wells. Within each well, TGFBR2 cells are compared with NT cells, and the well is the replicate unit. Cells that share a well count as one sample, not as independent replicates.
Load the tables
The run has four tables. B01-Cellecta is the guide identity panel and B01-QC_Panel is a control panel. All tables hold the same 258,896 cells in the same order.
from elembio_spatialdata_analysis.load import Loader

SDO_URI = (
    "s3://element-public-data/Cytos/elembio-multiomics/Cytos-MPS_TNFa-CRISPR-Screen/"
    "0c47c400756647deb9b3a37f502458de/spatialdata/Cytos-MPS_TNFa-CRISPR-Screen.zarr.zip"
)
loader = Loader(SDO_URI, storage_options={"anon": True})
identity = loader.load_tables(table="B01-Cellecta", lazy=True, include_target_assignment=True)
rna = loader.load_tables(table="ThreePrimeUntargeted", lazy=True)
imaging = loader.load_tables(table="imaging", lazy=True)
storage_options={"anon": True} reads the public bucket without credentials. For a local copy, pass the file path and omit storage_options. Lazy loading leaves the matrices in storage until a step needs them.
Call guides
Each cell's guide call is in identity.obsm["target_assignment"]. Keep calls with Confidence above 0.5, then collapse the four guides per gene to one gene-level label:
import numpy as np
import pandas as pd

assignment = identity.obsm["target_assignment"]
winner = pd.Series(np.asarray(assignment["MostAbundantTarget"])).astype(str).to_numpy()
confidence = np.asarray(assignment["Confidence"], dtype=float)
guide_names = pd.Series(np.asarray(identity.var_names)).astype(str).to_numpy()

guide_gene = np.array(
    ["NT" if name.startswith("NT_") else name.rsplit("_", 1)[0] for name in winner],
    dtype=object,
)
valid_assignment = np.isin(winner, guide_names) & (confidence > 0.5)
This threshold assigns about 87% of cells. The untreated wells hold 18,716 assigned TGFBR2 and NT cells for the knockout comparisons.
Compare RNA in knockout and control cells
To test for differential expression with replicates, sum raw 3′ counts into one pseudobulk sample per well and guide class. That gives 12 samples: 6 wells × TGFBR2 or NT. Then run DESeq2:
from pydeseq2.dds import DeseqDataSet
from pydeseq2.ds import DeseqStats

dds = DeseqDataSet(counts=rna_counts, metadata=rna_design, design="~guide_class", quiet=True)
dds.deseq2()
stats = DeseqStats(dds, contrast=["guide_class", "target", "NT"], quiet=True)
stats.summary()
rna_de = stats.results_df.sort_values("padj")
rna_counts is the 12-sample pseudobulk count table, and rna_design labels each sample target or NT. The notebook builds rna_counts chunk by chunk from the lazy table, so the full cell × gene matrix never loads into memory.
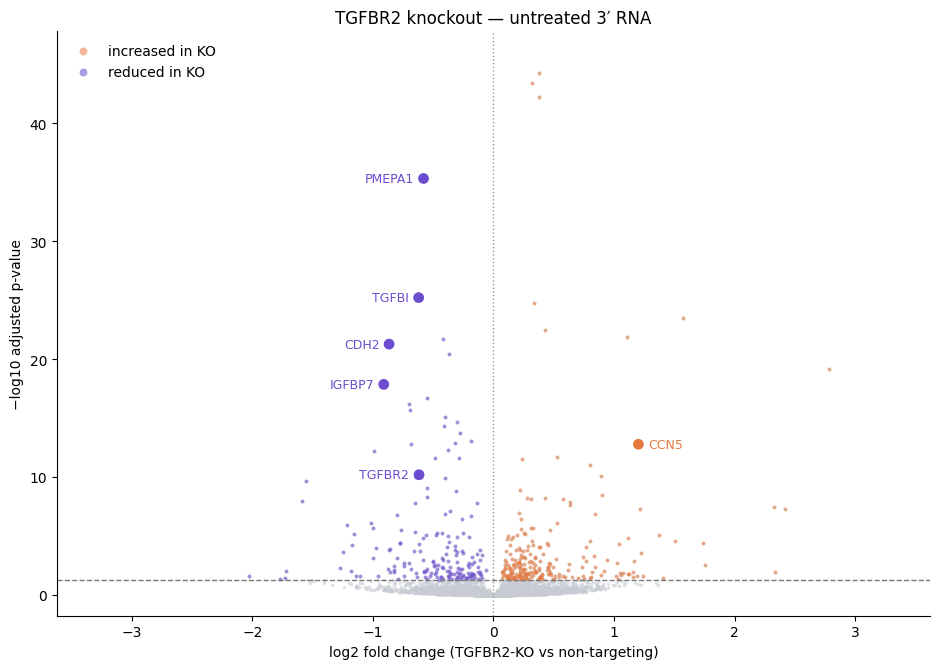
Of 12,648 genes tested, 400 reach an adjusted p-value below 0.05. Positive log2 fold change means higher in the knockout. The pattern matches TGF-β pathway loss:
- The TGFBR2 transcript itself falls, which confirms on-target editing.
- Canonical TGF-β and EMT targets fall with it: PMEPA1, TGFBI, CDH2, and IGFBP7.
- CCN5, which TGF-β normally represses, rises.
Compare morphology
The imaging table has 1,150 measurements per cell. Many are near-duplicates, and testing all of them across six wells leaves little power after multiple-testing correction. The notebook instead summarizes each of the four CellPaint stains with six measurements:
- Intensity
- Nuclear fraction
- Mass displacement
- Radial distribution
- Texture correlation
- Granularity ratio
That makes 24 tests. Cells are averaged per well and guide class first, so the six wells stay the replicate unit. A Welch t-test with Benjamini-Hochberg correction then compares TGFBR2 and NT well means:
from scipy.stats import ttest_ind
from statsmodels.stats.multitest import multipletests

well_means = morph_cells.groupby(["Well", "guide_class"], observed=True).mean(numeric_only=True)
rows = []
for feature in morph_features:
    ko = well_means.xs("TGFBR2", level="guide_class")[feature]
    nt = well_means.xs("NT", level="guide_class")[feature]
    rows.append({"feature": feature, "pvalue": ttest_ind(ko, nt, equal_var=False).pvalue})
results = pd.DataFrame(rows)
results["padj"] = multipletests(results["pvalue"], method="fdr_bh")[1]
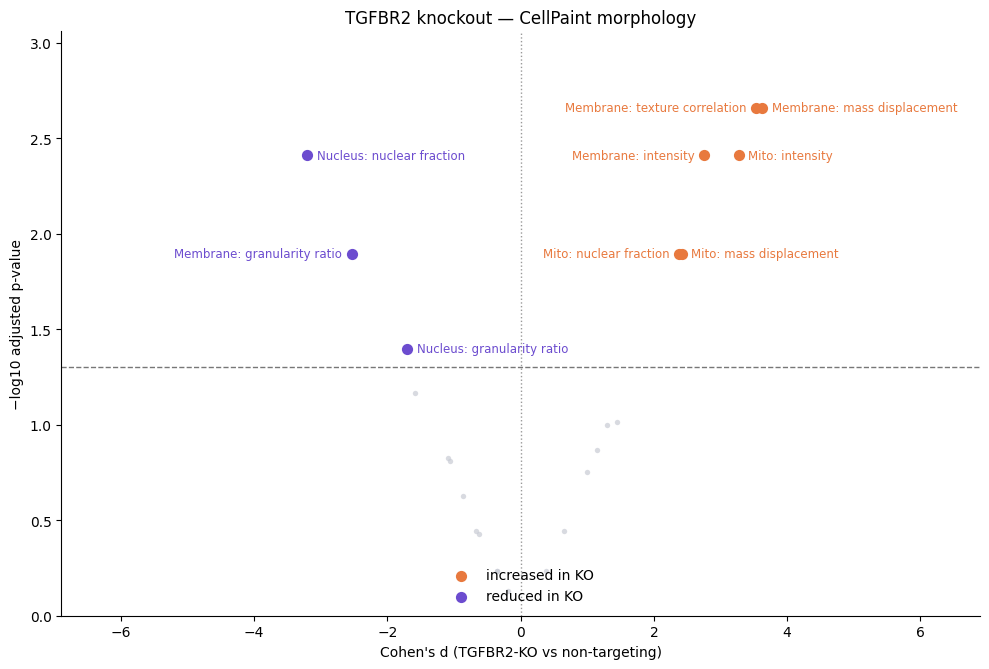
The strongest changes are higher membrane texture correlation and mass displacement, brighter mitochondria staining, and a lower nuclear fraction for the nucleus stain.
Embed protein state after TNFα
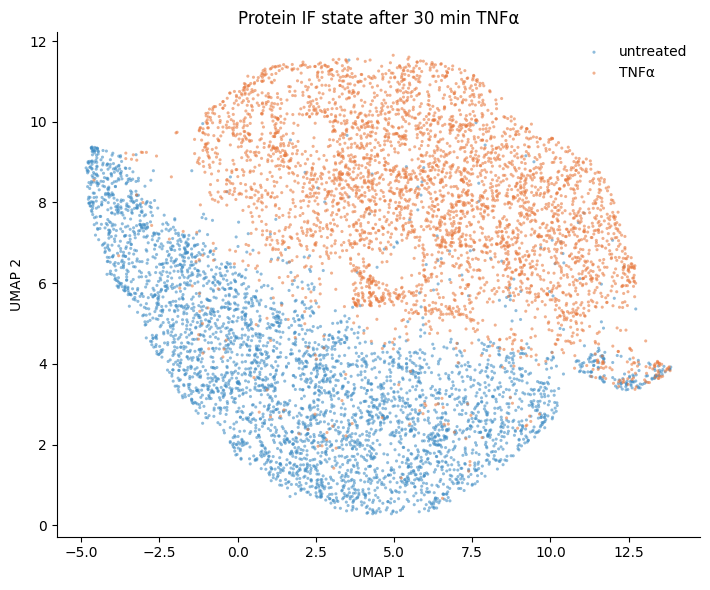
The third question compares treatment, not guides: does 30 minutes of TNFα shift signaling state? This step uses the four biological protein IF markers and leaves out the Mouse and Rabbit IgG isotype controls:
protein_markers = ["Phospho-ERK1_Phospho-ERK2", "ERK1_ERK2", "Phospho-HSP27", "Phospho-p38"]
The notebook prepares the intensities and then runs UMAP:
- Arcsinh-transform each marker's intensity.
- Subtract each tile's median, then add back the well median. This removes tile-to-tile offsets without removing differences between wells.
- Standardize each marker across the plate, with all cells as the reference.
- Sample 8,000 cells evenly across the 12 wells, then run UMAP.
Treatment is constant within each well, so do not center each well on itself. Centering a well on itself would remove the treatment contrast.
Next steps
- Rerun the comparisons with another guide target or a different confidence threshold.
- For a plate with one condition per well, see Measuring a 3′ treatment response.