Measuring a 3′ treatment response
Compare treated and vehicle wells with pseudobulk differential expression, then score a pathway in single cells.
When each well holds one condition, a 3′ transcriptome run supports two complementary views: well-level differential expression and a per-cell pathway score. This tutorial walks through a public HeLa tunicamycin dataset, where the expected response is the unfolded protein response (UPR). The complete, runnable code is in the tunicamycin case-study notebook.
Before you begin
- Install the multiomics Python package and JupyterLab. The install includes PyDESeq2 and Scanpy, which this tutorial uses.
- The tutorial streams the public Cytos-3Prime_HeLa-Tunicamycin example dataset from Amazon S3, so you do not need to download it or provide AWS credentials. To work from a local copy instead, use the download commands in the first section of the tunicamycin case-study notebook.
Experiment design
The plate has 12 wells of HeLa cells, with one condition per well and three wells per condition:
WellLabel | Condition |
|---|---|
Hela | Untreated |
HelaDMSO | DMSO vehicle |
Hela1ugTun | Tunicamycin, 1 µg/mL |
Hela2ugTun | Tunicamycin, 2 µg/mL |
The main comparison is tunicamycin 2 µg/mL versus DMSO. Each well is one replicate, so the test compares three wells with three wells.
Load the table and label conditions
import numpy as np
import pandas as pd
from elembio_spatialdata_analysis.load import Loader

SDO_URI = (
    "s3://element-public-data/Cytos/elembio-multiomics/Cytos-3Prime_HeLa-Tunicamycin/"
    "cb6f3a2ebb6c43acac4ad08b2b2a7779/spatialdata/Cytos-3Prime_HeLa-Tunicamycin.zarr.zip"
)
loader = Loader(SDO_URI, storage_options={"anon": True})
rna = loader.load_tables(table="ThreePrimeUntargeted", lazy=True)

LABEL_TO_CONDITION = {
    "Hela": "untreated",
    "HelaDMSO": "dmso",
    "Hela1ugTun": "tuni_1ug",
    "Hela2ugTun": "tuni_2ug",
}
cell_condition = (
    pd.Series(np.asarray(rna.obs["WellLabel"])).astype(str).map(LABEL_TO_CONDITION).to_numpy()
)
The table holds 150,732 cells and 54,949 genes. storage_options={"anon": True} reads the public bucket without credentials. For a local copy, pass the file path and omit storage_options. Lazy loading leaves the matrix in storage until a step needs it.
Compare treated and vehicle wells
Sum raw counts per well for the six wells in the comparison, keeping protein-coding genes (rna.var["gene_type"] == "protein_coding"). Then run DESeq2 with condition as the design:
from pydeseq2.dds import DeseqDataSet
from pydeseq2.ds import DeseqStats

dds = DeseqDataSet(counts=rna_counts, metadata=rna_design, design="~condition", quiet=True)
dds.deseq2()
stats = DeseqStats(dds, contrast=["condition", "tuni_2ug", "dmso"], quiet=True)
stats.summary()
rna_de = stats.results_df.sort_values("padj")
rna_counts is the six-sample pseudobulk count table, and rna_design labels each sample with its condition. The notebook builds rna_counts chunk by chunk from the lazy table, so the full cell × gene matrix never loads into memory.
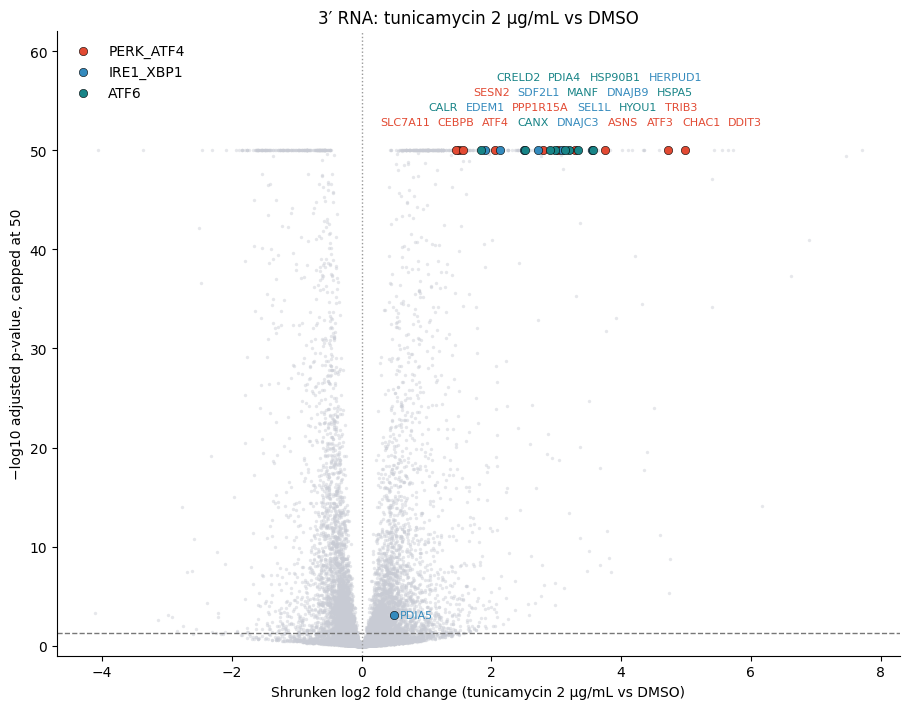
Of 13,418 protein-coding genes tested, 6,544 reach an adjusted p-value below 0.05. All 24 pre-specified UPR genes in the tested set are significantly higher in tunicamycin, across all three branches: PERK/ATF4 (for example, CHAC1 and TRIB3), IRE1/XBP1 (for example, HERPUD1 and DNAJB9), and ATF6 (for example, HSPA5 and CRELD2).
The strongest adjusted p-values are too small to represent in 64-bit floats and round to zero. The notebook caps the y-axis at 50 so those genes stay on the plot.
Score the response in single cells
A pathway score asks whether a known program separates treatments cell by cell, without clustering. The notebook takes the following steps:
- Sample 600 cells per well across all 12 wells.
- Library-size normalize and log-transform the counts.
- Score each cell on the union of the three UPR gene lists.
- Lay out the cells in a UMAP built from highly variable genes, and color each cell by its score.
import scanpy as sc

sc.pp.normalize_total(sample, target_sum=1e4)
sc.pp.log1p(sample)
sc.tl.score_genes(sample, upr_genes, score_name="UPR_score", random_state=0)
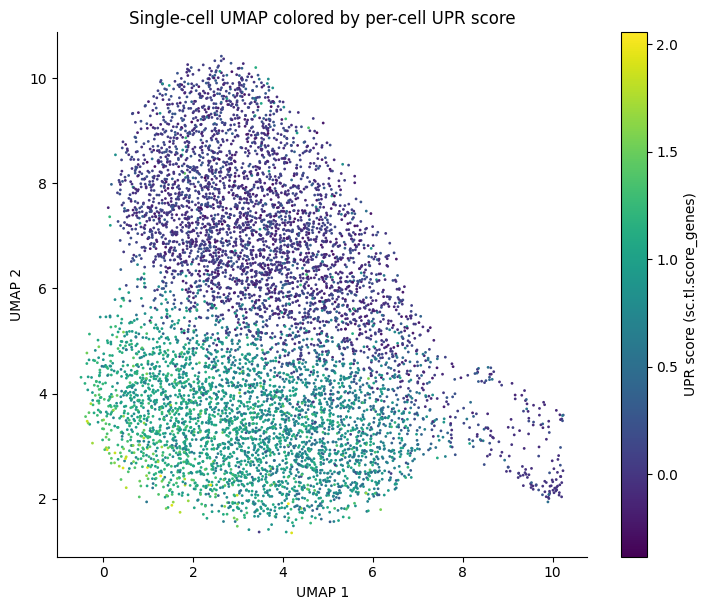
Mean UPR scores separate the treated wells from the controls:
| Condition | Mean UPR score |
|---|---|
| Untreated | 0.041 |
| DMSO | 0.039 |
| Tunicamycin, 1 µg/mL | 0.824 |
| Tunicamycin, 2 µg/mL | 0.867 |
Next steps
- Run the same comparison for tunicamycin 1 µg/mL versus DMSO, or untreated versus DMSO.
- To find cell groups without a pre-specified gene set, see Clustering cells with Python.