Prepare data and create a canvas
Learn how to prepare input data, navigate the dashboard, and create a canvas in CytoCanvas Studio.
Understand the canvas workspace
A canvas is a workspace to visually inspect and analyze cytoprofiling run. Each canvas points to a set of visualization input files that are the top-level entity for all exploration activity. Once a canvas is created, you can:
- Save flow cell visualization states as a view.
- Share a canvas with your team members in your organization, or share an anonymous read-only view.
Understand the input data file format
CytoCanvas Studio™ uses a Cells2Stats visualization output as its input dataset. The cyto.viz file in the visualization output instructs the visualizer how to load visualization files and targets.
- After your AVITI24 cytoprofiling run is complete, visualization files are automatically generated for ElemBio Catalyst users via Cells2Stats executions.
- For help manually generating visualization files for data stored in your own AWS bucket, see the Cells2Stats Visualization Files for CytoCanvas tutorial.
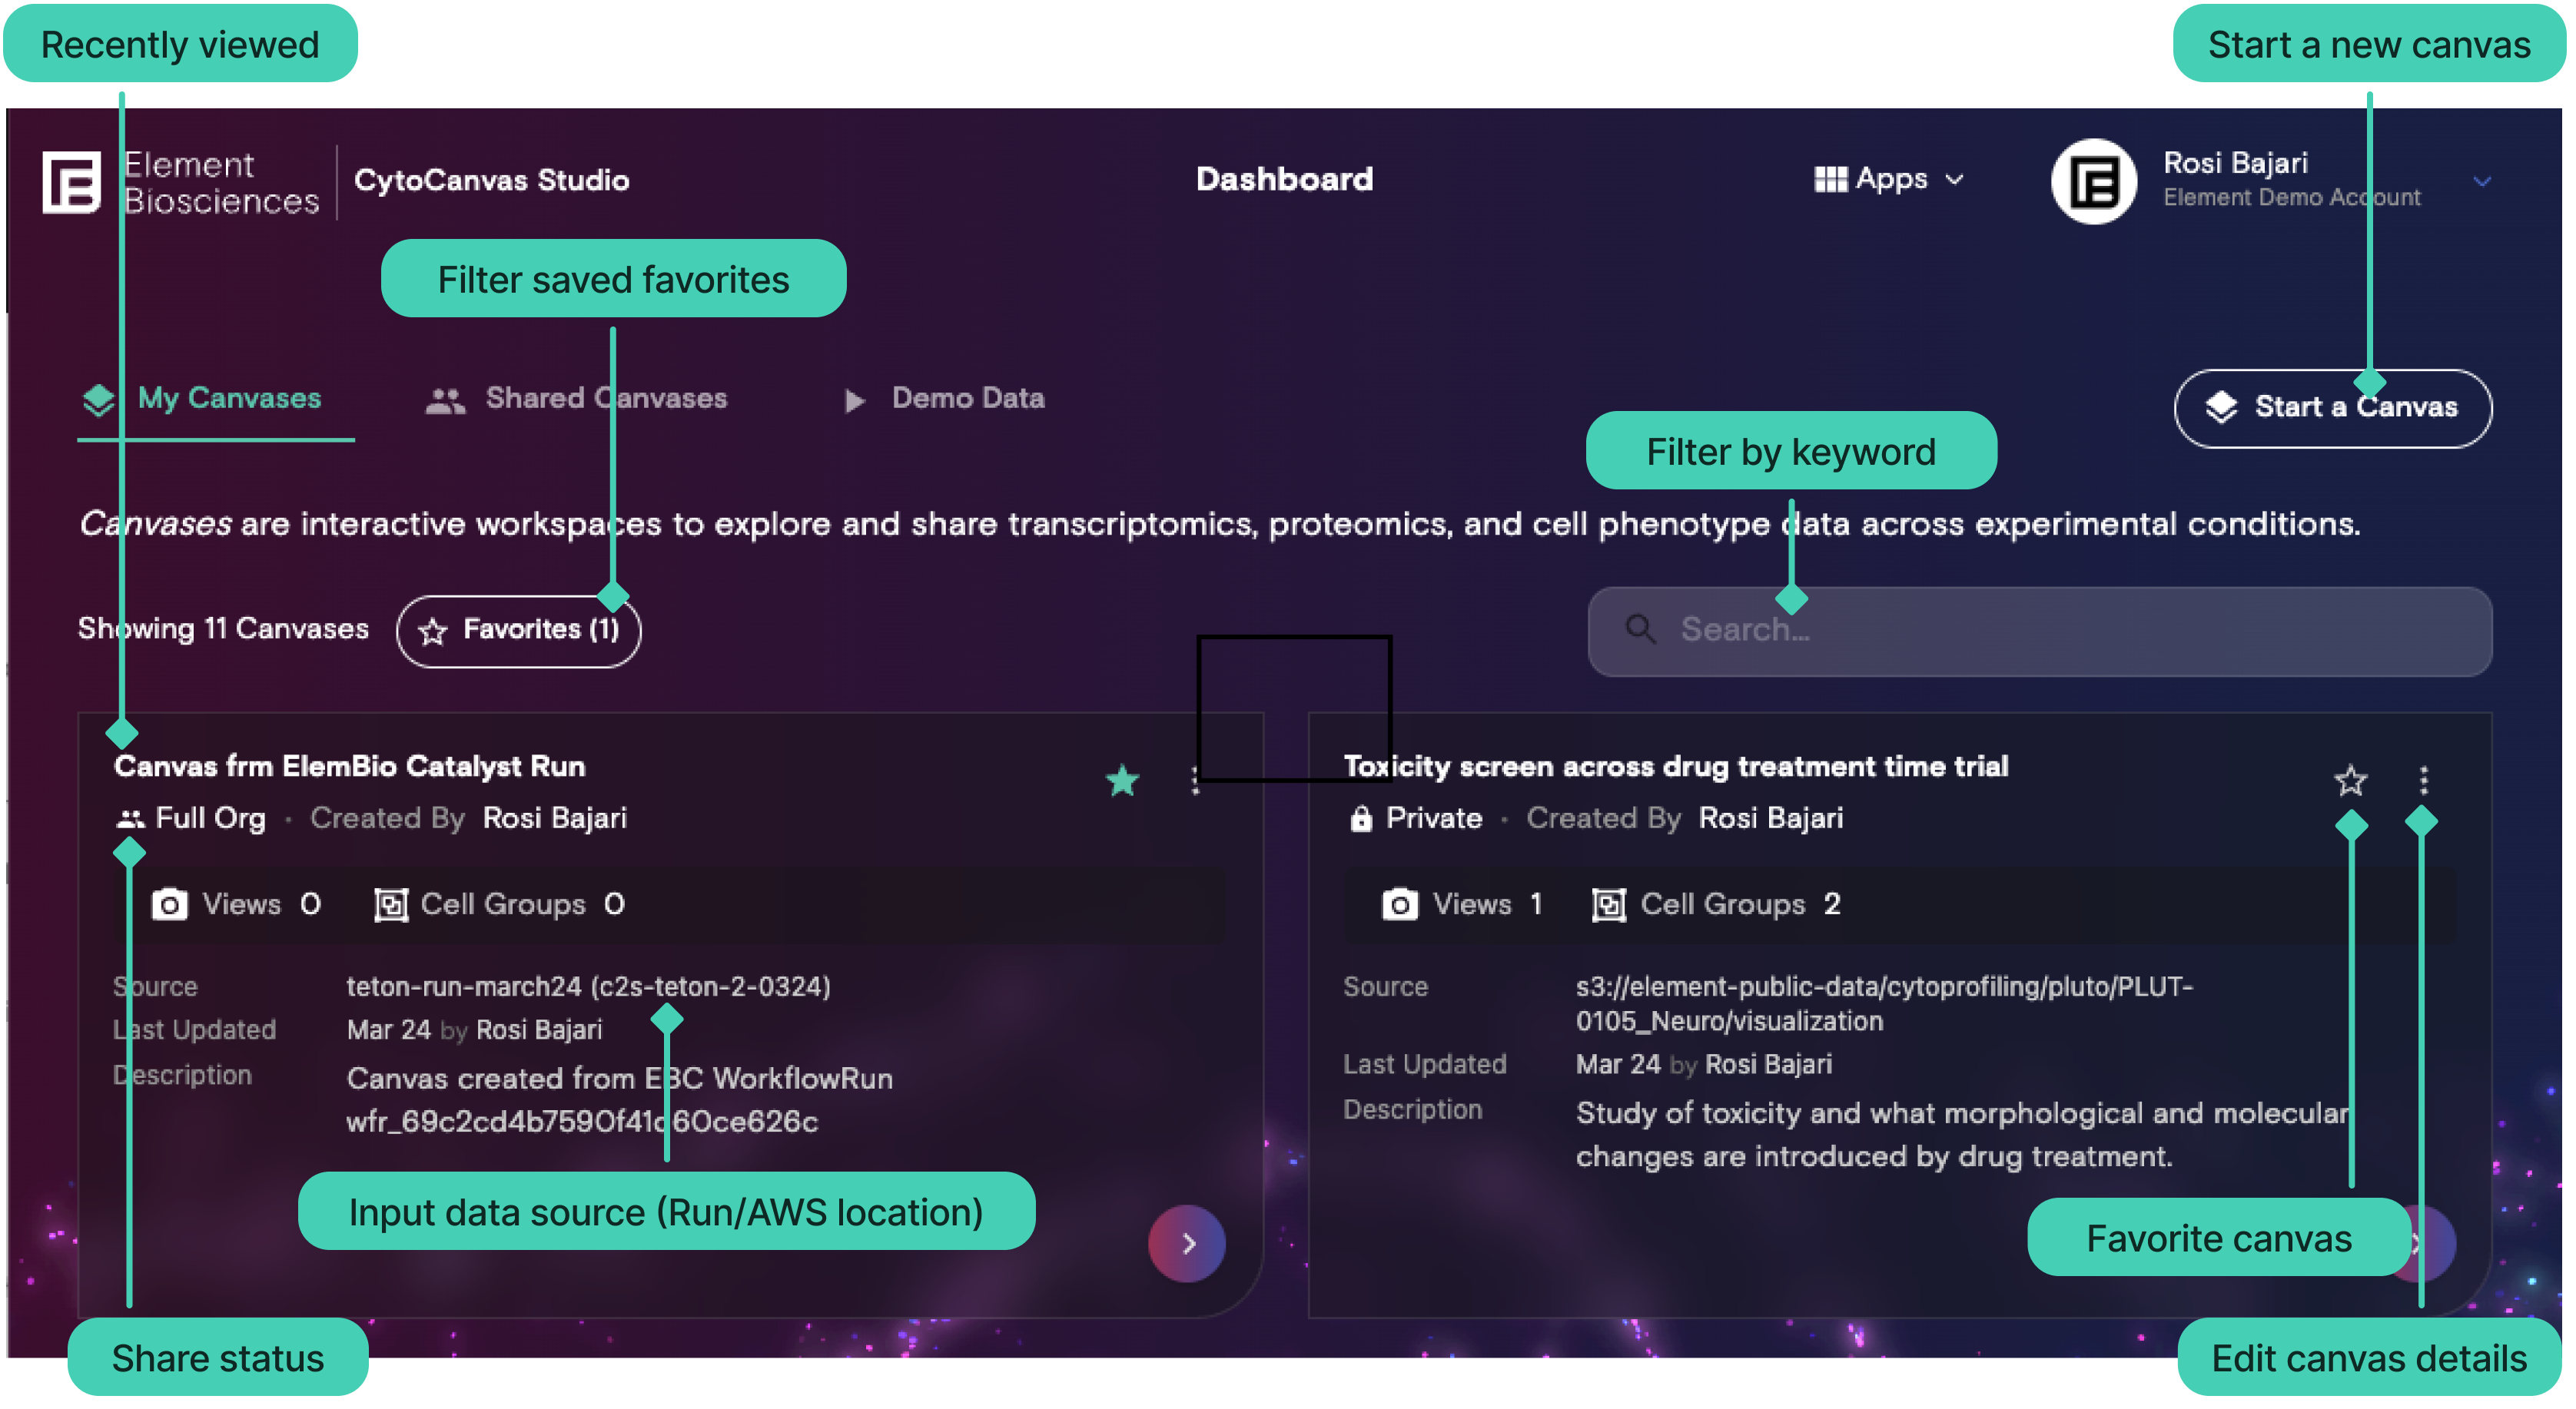
Dashboard overview
CytoCanvas Studio opens the dashboard on login. The dashboard organizes your canvases into three tabs:
| Tab | Description |
|---|---|
| My Canvases | Canvases that you created. |
| Shared Canvases | Canvases shared with your ElemBio Cloud team members by yourself and other ElemBio Cloud team members. |
| Demo | Demo datasets to exploring CytoCanvas Studio features and Teton datasets. |
Each canvas card displays the canvas name, creator, access level, number of saved views, and number of cell groups. From a canvas card, you can favorite, clone, manage, share, or delete the canvas.
Use the search bar to filter canvases by name, run name, or execution ID. Select the star filter to display only your favorited canvases.
CytoCanvas Studio supports three ways to open AVITI24 cytoprofiling datasets into a canvas:
- Open from ElemBio Catalyst: Automatic access to ElemBio Catalyst-managed executions output.
- AWS S3 storage connection in ElemBio Cloud: Access data in your own AWS S3 bucket through an ElemBio Cloud storage connection.
- Anonymous AWS access: Access any AWS S3 location by entering credentials directly at canvas creation time.
Start a canvas from ElemBio Catalyst
If your cytoprofiling data is processed through ElemBio Catalyst, visualization output from the Cells2Stats pipeline is stored in Catalyst-managed buckets. CytoCanvas Studio can access this data automatically.
Start from ElemBio Cloud
- Select an ElemBio Cloud navigation path then select View in CytoCanvas.
You will be navigated to CytoCanvas Studio with a canvas created for you.
Start from CytoCanvas
- From the Dashboard, select Start a Canvas.
- Select ElemBio Cloud.
- Search for and select the cytoprofiling run that you want to visualize.
- Select Create.
CytoCanvas Studio validates the visualization data and opens the canvas in the Viewer.
Start a canvas from an AWS storage connection in ElemBio Cloud
If your visualization data is stored in your own Amazon S3 bucket, you can make it available to CytoCanvas Studio by connecting the bucket as a storage connection in ElemBio Cloud. If you have multiple runs in the same bucket, this allows you to reuse a credential across team members in a secure manner.
- Follow the instructions to setup an AWS storage connection in ElemBio Cloud.
- Ensure the CORS configuration to your AWS S3 bucket so that CytoCanvas Studio can load data in the browser.
- From the Dashboard, select Start a Canvas.
- Select AWS.
- Select an ElemBio Cloud Provider from the dropdown.
- Select the AWS region the bucket is located in.
- Enter the path to visualization as the S3 URI to the visualization data (for example,
s3://your-bucket-name/path/to/visualization/). - Enter a canvas name and an optional description.
- Select Start Canvas.
CytoCanvas Studio validates the visualization data and opens the canvas in the Viewer.
Start a canvas from any AWS bucket with credentials
Cytoprofiling data in any AWS bucket may be visualized in CytoCanvas Studio without having to login, provided that you have a credential with access to the data. To load any generic AWS location:
- From the Dashboard, select Start a Canvas.
- Select AWS.
- Select Enter new credentials.
- Provide the Role ARN, or the AWS Access Key and Secret Key and optional Session Token if provided.
- Select the AWS region the bucket is located in.
- Enter the path to visualization as the S3 URI to the visualization data (for example,
s3://your-bucket-name/path/to/visualization/). - Enter a canvas name and an optional description.
- Select Start Canvas.
CytoCanvas Studio validates the visualization data and opens the canvas in the Viewer.