Visualization panels and controls
Use the visualization panels and controls to customize how imaging data, proteins, and transcripts are displayed in the Flow Cell view.
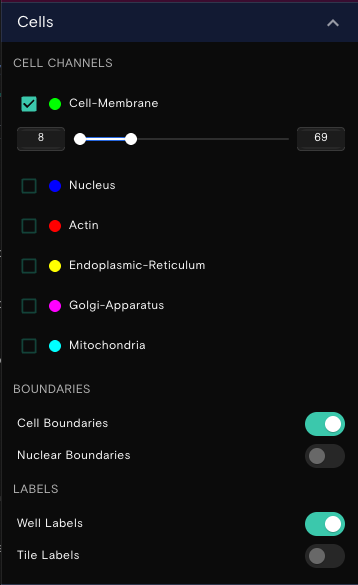
Cells panel
The Cells panel contains controls for cell paint channel visibility and appearance, as well as boundary and label overlays. It combines the imaging controls from previous versions with the boundary and label options that were previously found in the View Options panel.
- Target Visibility: To toggle the target visibility on or off, select or unselect the checkbox.
- Target Color: To customize the target color, select the color indicator circle, and then update the color.
- Color Contrast: To modify the target color contrast, set the [begin, end] values of the slider function for that cell channel.
- Cell Boundaries: Toggle cell and nuclear boundary overlays on or off.
- Well and Tile Labels: Toggle well labels and tile labels on or off for display while panning the flow cell.
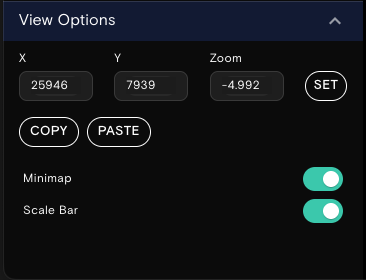
View options panel
The View Options panel allows you to control viewport navigation and display settings. It now includes the coordinate navigation and zoom controls that were previously in the Location Controls panel.
- X and Y Coordinates: Set, copy, or paste exact X and Y coordinates to navigate to a specific position on the flow cell.
- Zoom Level: Copy or paste the current zoom level to replicate a specific view.
- Minimap: Toggle the minimap on or off and set the position of the minimap.
- Scale Bar: Toggle the scale bar on or off.
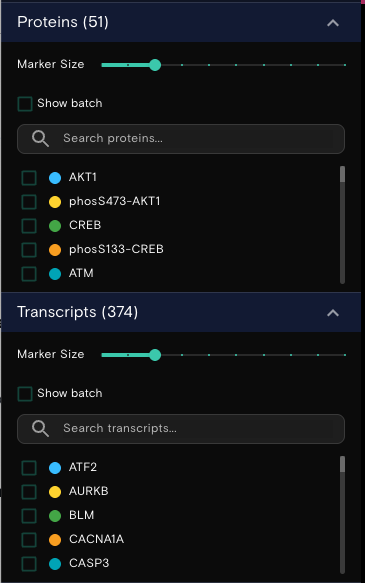
Proteins and transcripts panels
Dots on the visualization indicate the locations of the proteins and transcripts. The Proteins and Transcripts panels contain the following controls:
- Marker Size: Adjusts the size of the dots that are displayed in the view.
- Show batch: Toggles the associated batch name for proteins and transcripts.
- Search bar: Locates specific proteins and transcripts.
You can modify the appearance of protein and transcript targets as follows:
- Target Visibility: Toggles the protein or transcript visibility on or off.
- Target Color: To customize the protein or transcript color, select the color indicator circle, and then update the color.