Explore and filter flowcell data
Use the Flow Cell and Montage views to visualize, filter, and compare cells in a CytoCanvas Studio canvas.
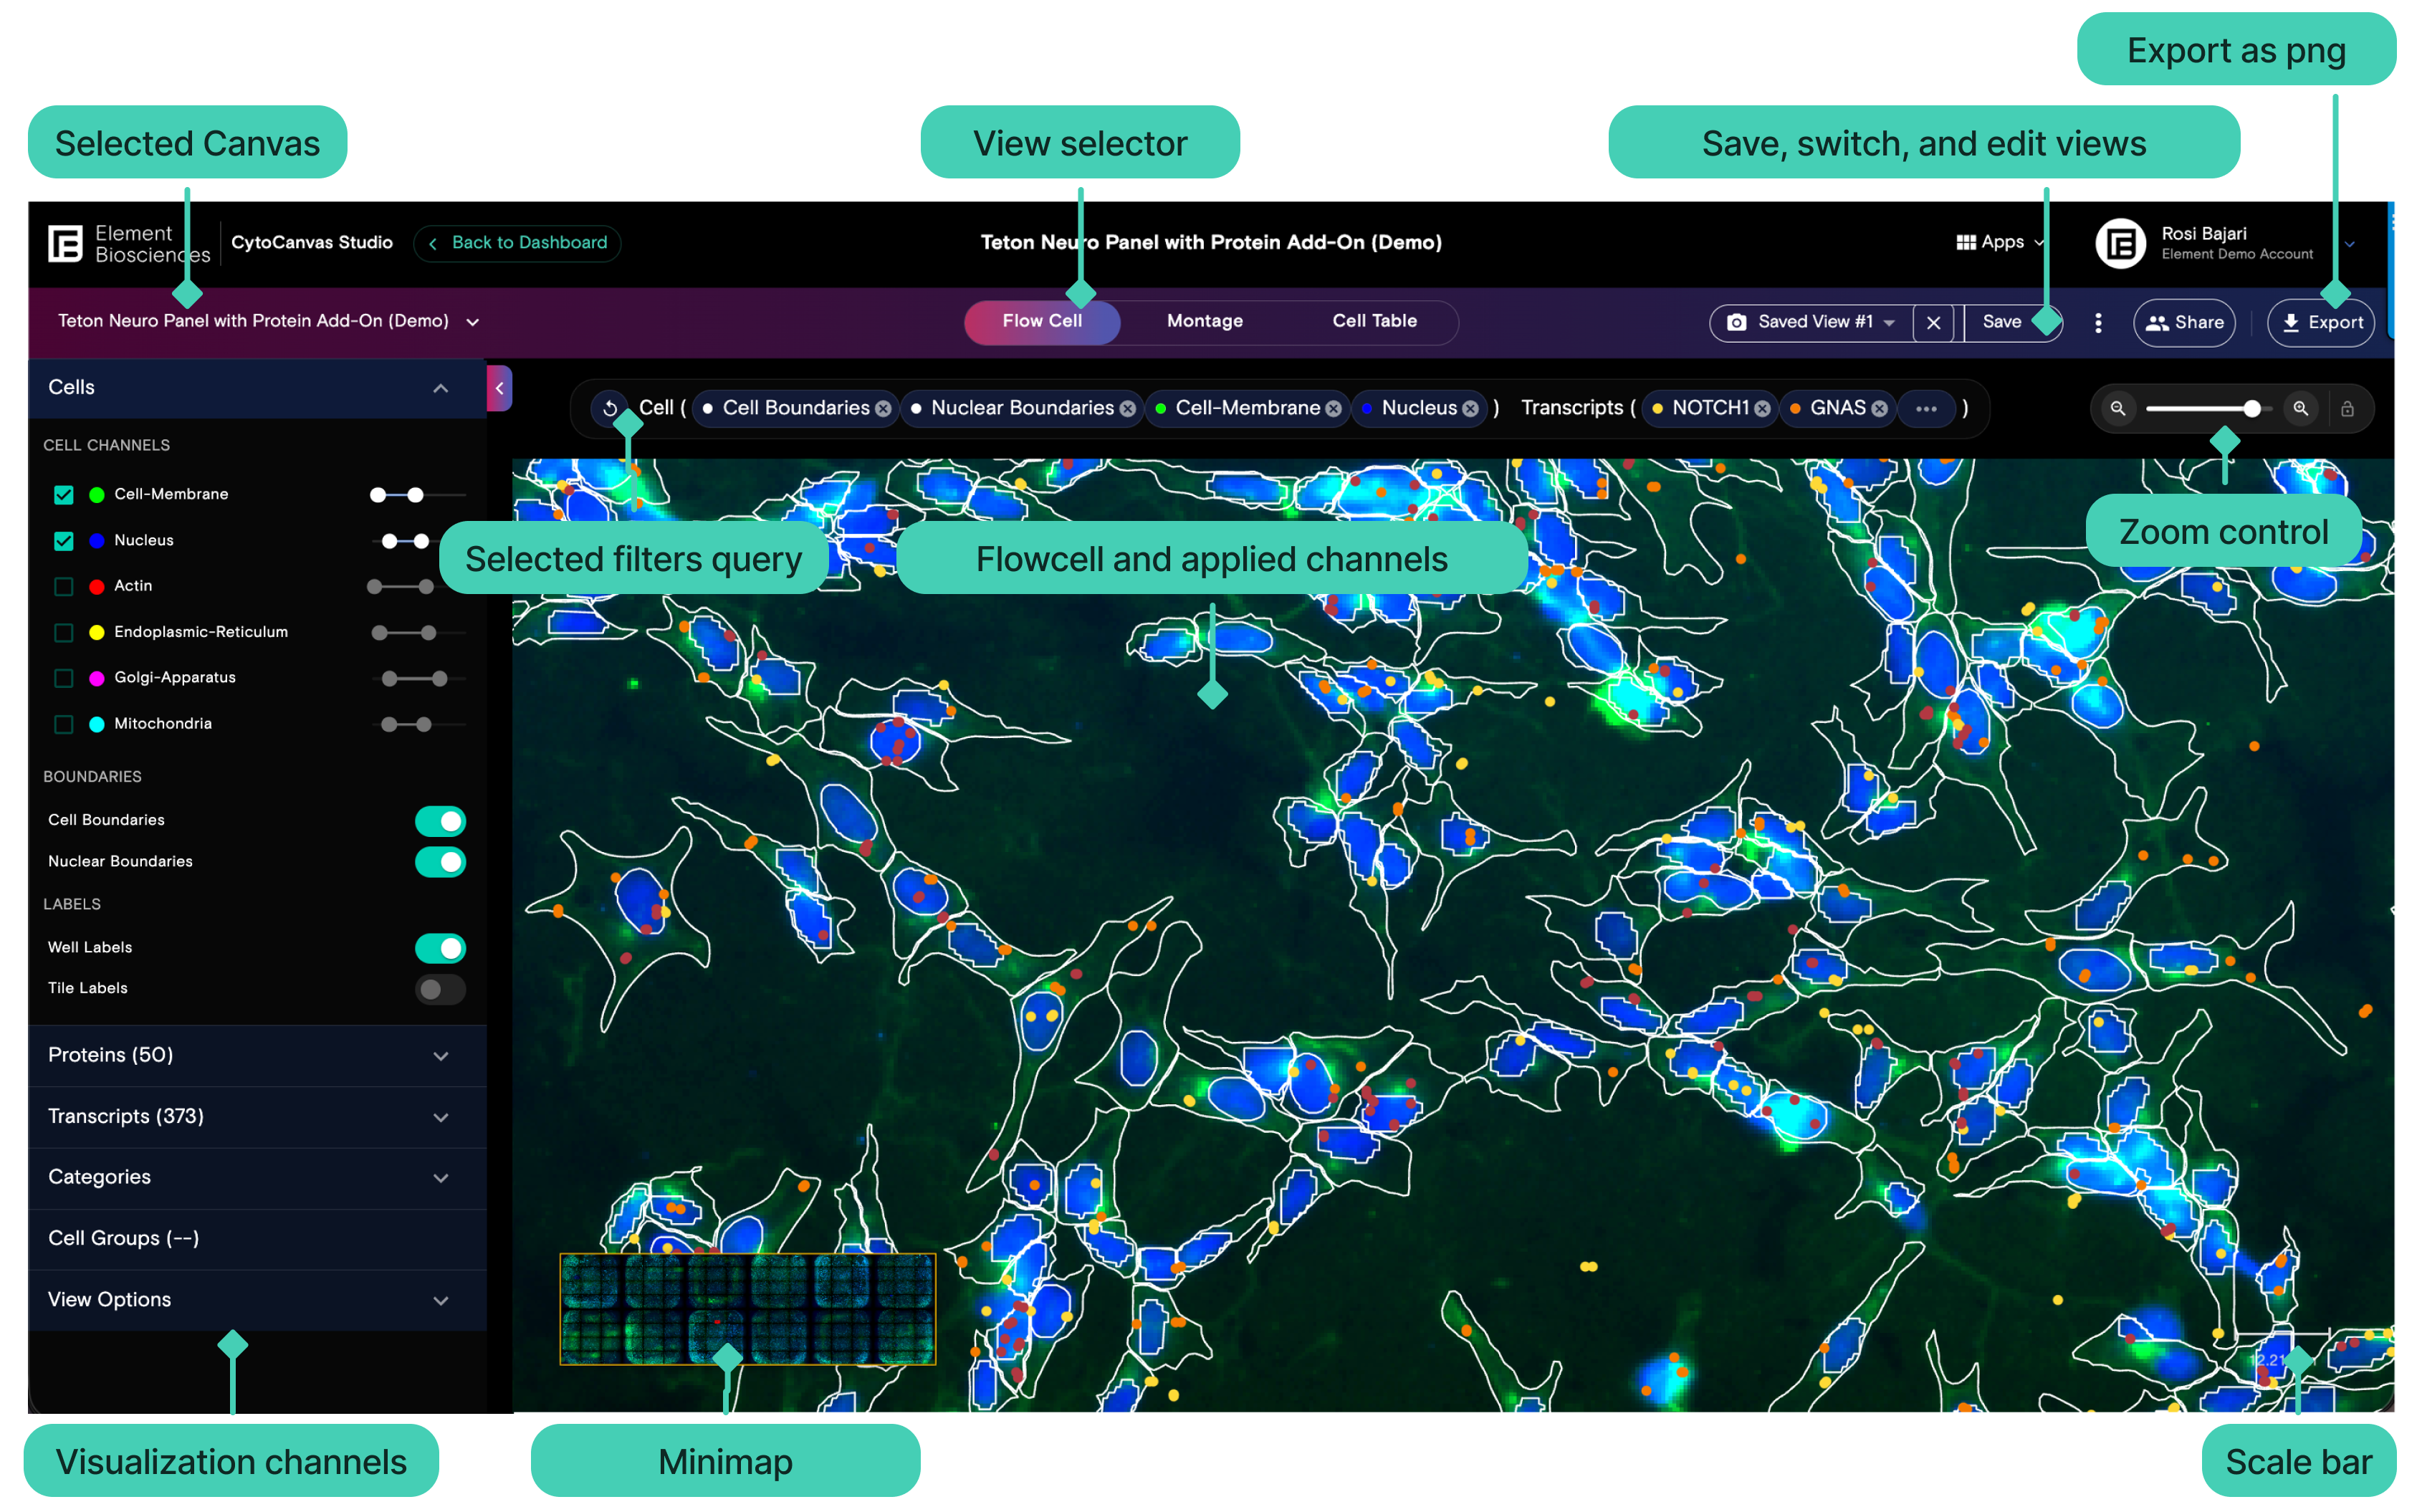
The flow cell view
CytoCanvas Studio™ provides the Flow Cell view, which displays the full spatial layout of a flow cell. Navigate wells to inspect cell morphology, protein markers, and transcript locations. Use the panel controls to adjust channel visibility, cell boundaries, and metadata overlays. The Flow Cell view supports basic run QC, segmentation mask verification against raw fluorescence images, and spatial analysis of RNA transcripts and proteins.
Apply features to curate the cell images
Use the sidebar panel controls to adjust channel visibility, overlay boundaries, customize colors, and fine-tune your visualization in Flow Cell and Montage views.
| Action | Panel | Description |
|---|---|---|
| View cell morphology and boundaries | 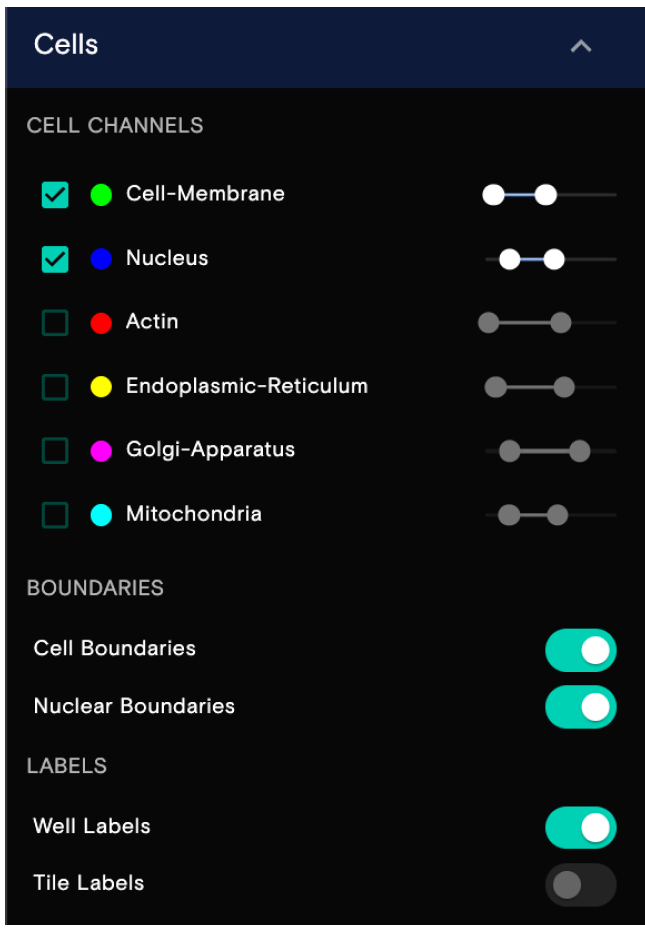 | View cell paint images and confirm cell and nuclear segmentation.
|
| View protein and transcript points | 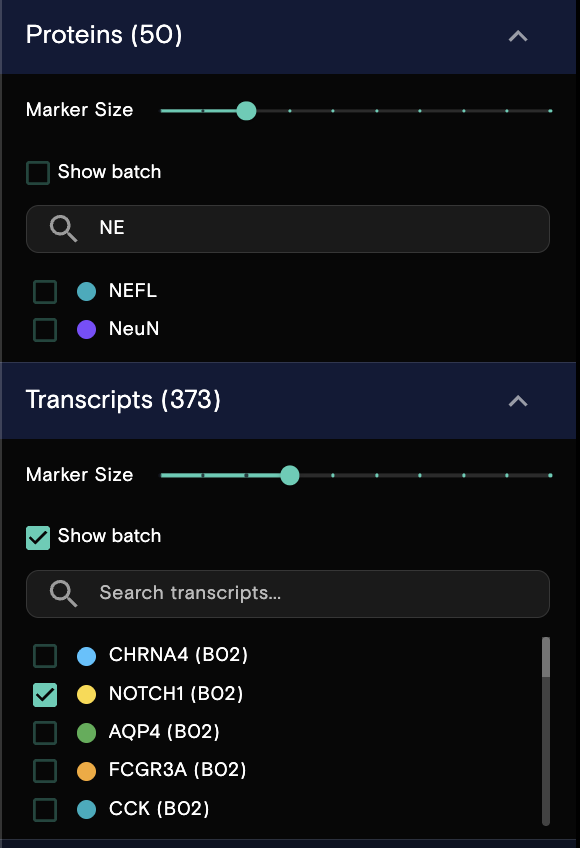 | View spatially located cell features like RNA transcripts and proteins.
|
| Group cells by category | 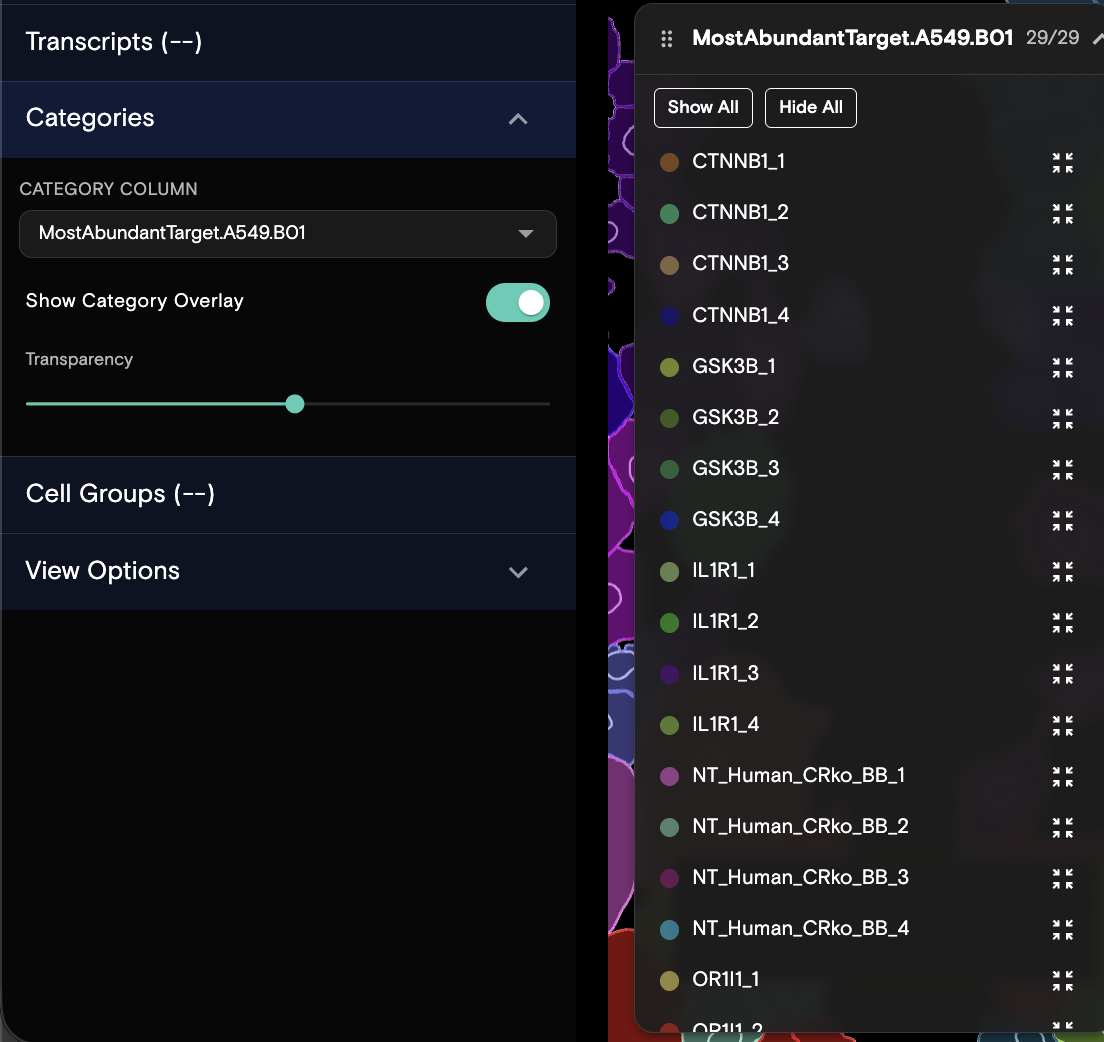 | Select a non-numeric column from the Cell Table to use as the category source and color-code cells based on the categorical data.
|
| Configure the flow cell view options | 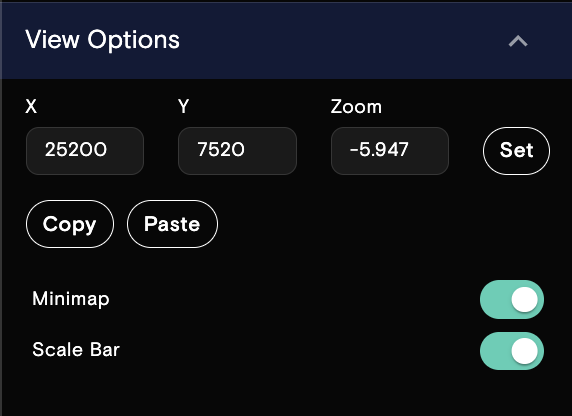 | Adjust the viewport of the flowcell.
|
Create a saved flowcell view
A saved view is a snapshot of all visualization settings applied to a flowcell. Use saved views to bookmark specific visualization states and return to them later, or use the view switch to compare two flowcell views. Saved views capture the following selections:
- Selected channels, channel color, and channel contrast limits
- Cell and nuclear boundary display
- Viewport position, zoom level, and view settings
- Selected transcript and protein points
- Applied cell groups and categories settings
Save a view
- Configure the visualization to the desired state.
- From the top bar, select the Save dropdown.
- Select Save as new view.
- Enter a name and an optional description.
- Select Save View.
The view is saved and can be selected from the view dropdown.
Update an existing view
- With a view selected, adjust the visualization settings as needed.
- From the top bar, select the Save dropdown.
- Select Save current.
The selected view is overwritten with the current settings.
Export a flowcell or montage image
A flowcell or montage image can be exported.