Remote run monitoring
ElemBio™ Cloud synchronizes with connected systems to update run monitoring information in real time. Runs can be monitored from the following areas:
- Active Runs: Summarizes information for the most recent runs, grouped by instrument.
- All Runs: Displays information for active and historical runs from connected systems.
- Run Details: Displays detailed information for a run.
Active runs
Cards on the Active Runs page display high-level information about each active and recently completed run. The page orders the cards by instrument and side A or B, which resembles the instrument display. A dynamic gauge graphic on each card visualizes the run progress and the number of cycles or batches completed, with colors that change based on different statuses.
The active run cards update as follows:
- When a run is in progress, the card information updates in real time.
- The card title indicates if it is a sequencing or cytoprofiling run, and the card links to the Run Details page for the run.
- When a run is no longer in progress, the card displays information for the last run executed. The card footer indicates the side is available, and the card links to the Run Details page for the run.
- The card always displays a badge for the most recent run status.
Example cards on an Active Runs page 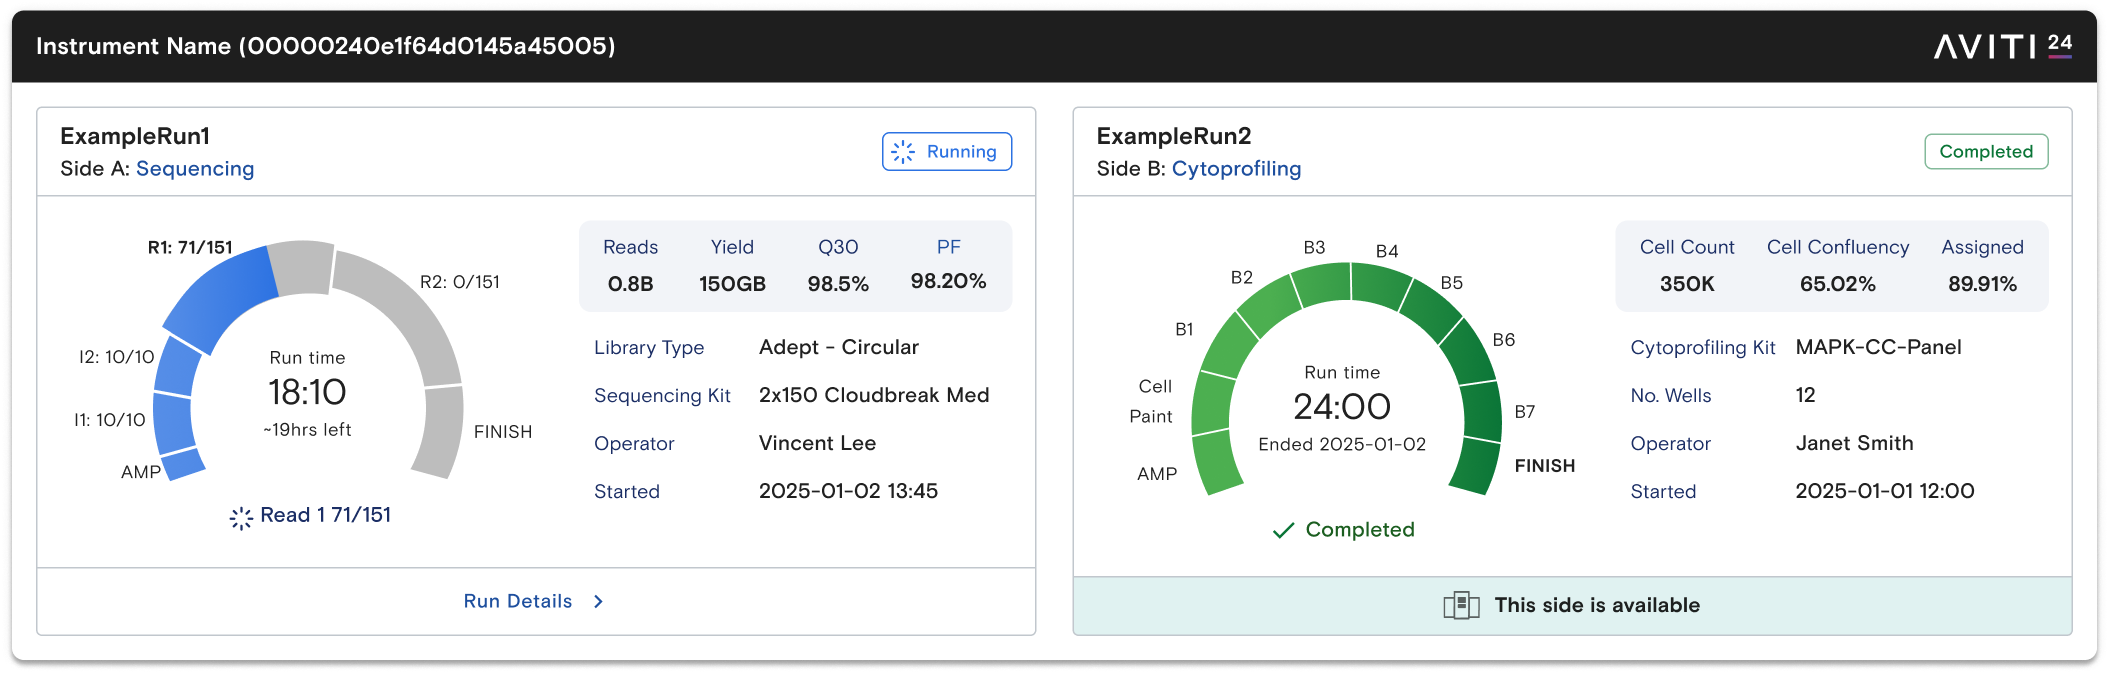
Run statuses
| Status | Gauge Color | Description |
|---|---|---|
| Priming or Primed | Blue | The run is in setup mode. Metrics do not populate before sequencing starts. |
| Running | Blue | The run is actively progressing. Metrics populate as they become available. |
| Pausing or Paused | Orange | The run is pausing or paused for flexible start. The run resumes automatically. |
| Completed | Green | The run successfully completed. The instrument completed data transfer to the selected storage location. |
| Failed | Red | The instrument encountered a critical issue during the run and cannot progress. Data analysis has been completed through the last successful cycle or batch, and the instrument transferred available data to the selected storage location. |
| Stopped | Teal | A user stopped the run before it completed. Data analysis has been completed through the last successful cycle or batch, and the instrument transferred all data to the selected storage location. |
All runs
The All Runs table displays a complete list of sequencing and cytoprofiling runs for active and historical runs. The Run Name links to the Run Details page for the run. To filter run data, customize visible columns, or manage your view, use the available options.
Replan a run
Replan an existing run to create a new planned run from the configuration of a completed or active run.
- On the All Runs page, locate the run that you want to replan.
- In the Actions column, select the three dots (...), and then select Replan this Run Config.
- ElemBio Cloud creates a new planned run and opens it in the planning form.
- Update the run information as needed.
- Select Save Run.
For field-level details, see the run planning documentation for sequencing and cytoprofiling.
Remove a run
To eliminate a run from view in ElemBio Cloud, remove the run. While a removed run no longer appears, the data remains archived and hidden. If you want to restore a removed run, contact Element Technical Support.
To remove a run, complete the following:
- On the All Runs page, locate the run that you want to remove.
- In the Actions column, select the three dots (...), and then select Remove.
- When prompted, enter the name of the run.
- Select Remove.
Run details
A Run Details page displays the complete record of a run and the associated flow executions.
The Run Details page includes the following features:
- Run Overview: Visualizes the current run status in a gauge graphic.
- Analysis Overview: Indicates the status for analysis executions and displays key primary analysis metrics.
- Sequencing: Reads, yield, Q30, and percentage of reads passing filter (%PF).
- Cytoprofiling: Cell count, cell confluency, and percentage assigned.
- Run Setup: Displays summary run setup information.
- Run Configuration: Displays detailed run setup information for sequencing and cytoprofiling runs and includes reagent cartridge, buffer bottle, and flow cell details.
- Primary Analysis: Detailed and interactive charts of run metrics.
- Sequencing: Includes charts for Q Scores, PhiX Error Rate, Base Composition, Flow cell Thumbnail, Indexing Assignment, and primary analysis metrics.
- Cytoprofiling: Includes charts for Differential Expression Levels, Assignment (% Assigned), and Quality Controls.
- Run Files: Displays files output from runs that use a compatible provider.
- Analysis Executions: Displays a list of analysis flow executions when you use cloud-hosted flows and enables relaunch.
- CytoCanvas™ Call to Action: (For cytoprofiling only) Displays a quick way to download the latest version of the CytoCanvas desktop application for transcriptomics, proteomics, and cell phenotypes exploration.
Sensitive metadata
By default, AVITI™ OS sends the following metadata to a secure and customer-specific ElemBio Cloud database:
- Run description
- Sample names from the sequencing run manifest, if applicable
- Well labels from the cytoprofilng run manifest, if applicable
The ElemBio Cloud database is separate from the telemetry database. Therefore, telemetry does not collect metadata. If you prefer to keep metadata on-instrument, contact Element Technical Support and request Restrict Metadata mode. When Restrict Metadata mode is enabled, a lock appears on the run description in ElemBio Cloud, and the sample and well names in the run manifests are masked as numbers. The numbering is based on the order of samples or wells in the run manifest.
Troubleshooting run monitoring
If ElemBio Cloud data seems out-of-sync with instrument data, the instrument might have lost the network connection. To troubleshoot, complete the following:
- Reconnect the instrument to the network, and then make sure that the data updates in ElemBio Cloud.
- If the issue persists, contact Element Technical Support.