MPS run monitoring metrics
Review the metrics the AVITI24™ System reports while an MPS run is in progress.
The AVITI24 System reports the following metrics for multimodal pooled screening runs:
| Metric | Description | Included when |
|---|---|---|
| Thumbnail | Flow-cell snapshot per well. | Always |
| OPS Target Assignment | Percent of reads assigned to a target site, per well. | Always |
| OPS vs. Controls | Target-vs-control comparison across wells. | Always |
| Q-Scores | Per-cycle base quality scores. | Always |
| Base Composition | Per-cycle base composition. | Always |
| Protein IF | Immunofluorescence signal per protein target. | Protein detection added |
Run analysis overview
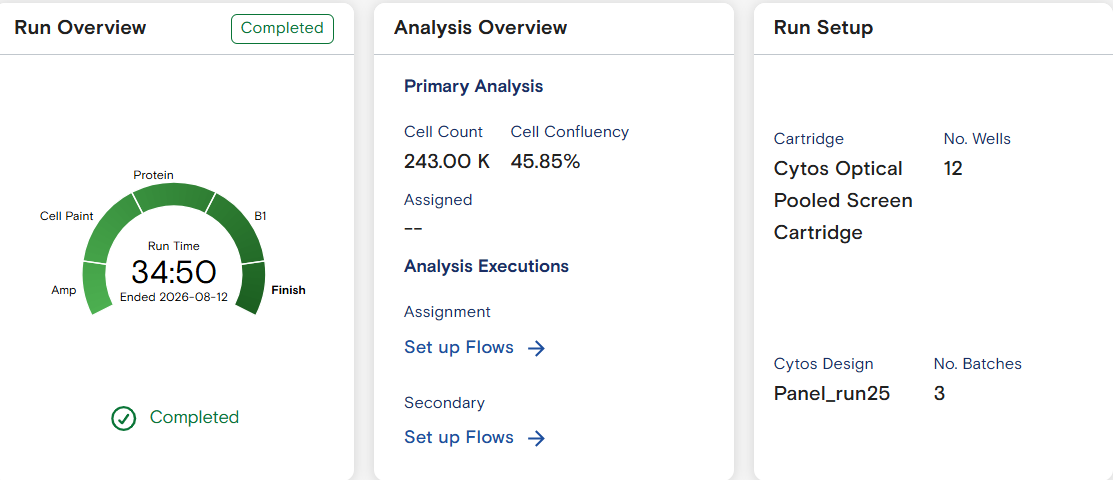
The Analysis Overview on the Run Details page summarizes run progress and key primary analysis metrics in real time as each well is processed.
The gauge color reflects run status: blue (priming or running), orange (pausing or paused, resumes automatically), green (completed), red (failed), and teal (stopped by a user). For the full status reference, see Remote run monitoring.
Metric examples
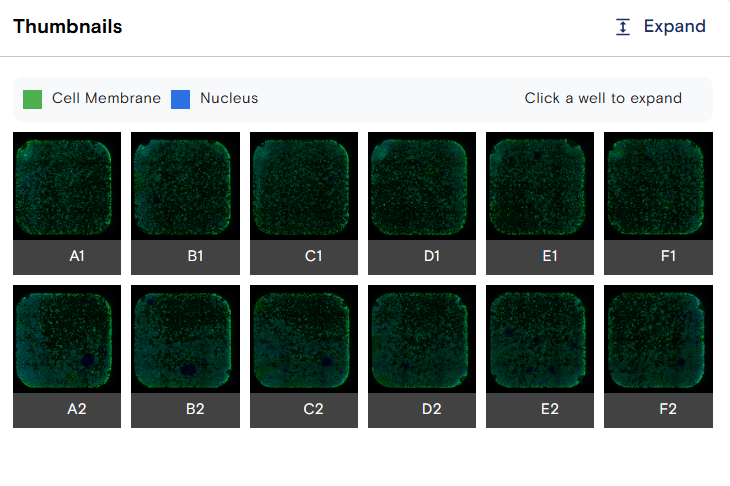
Thumbnail
A per-well flow-cell snapshot. Use it to confirm seeding, cell membrane, and nuclear cell paint quality.
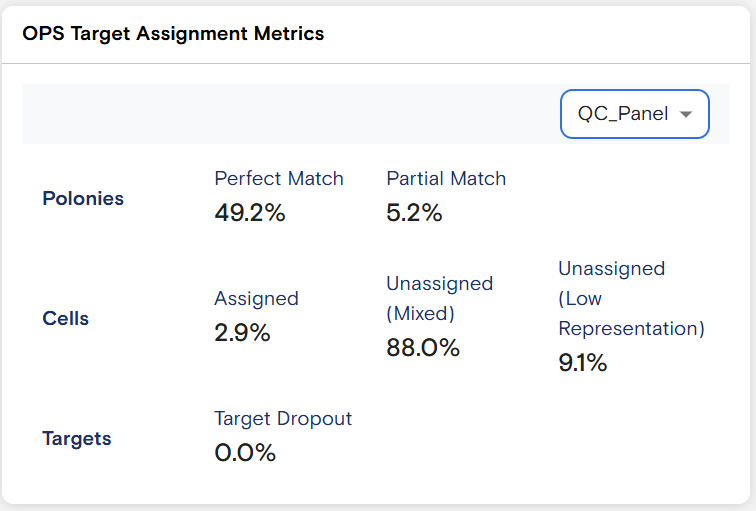
OPS Target Assignment
Percent of reads assigned per TargetSiteName or labelled condition, selectable via dropdown.
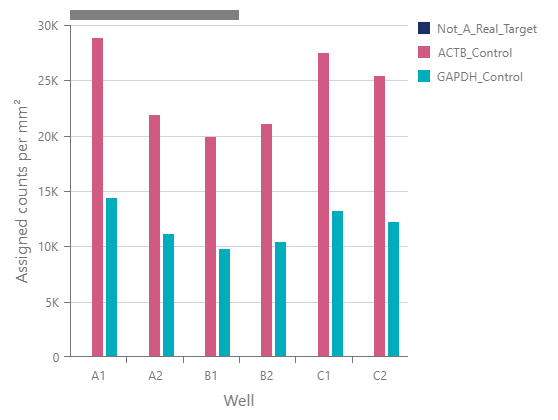
OPS vs. Controls
Target-versus-control comparison of assigned counts per target and well.
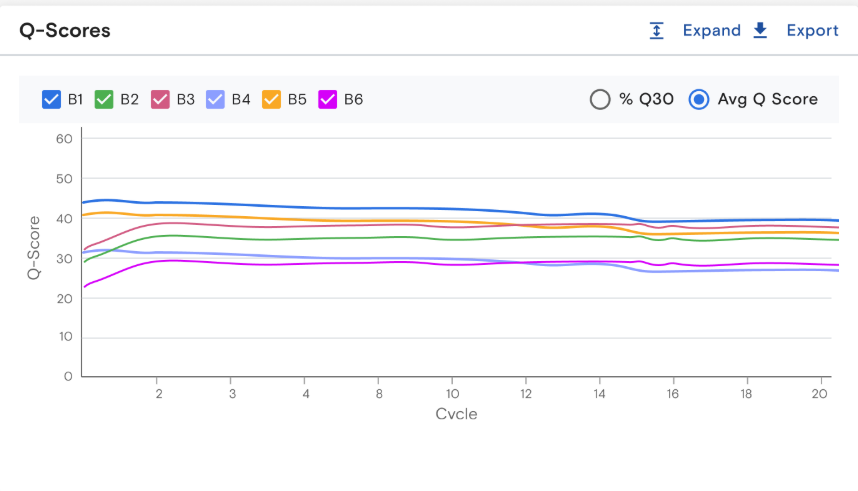
Q-Scores
Base quality scores per cycle. Scores can be viewed per batch when multiple batches are present.
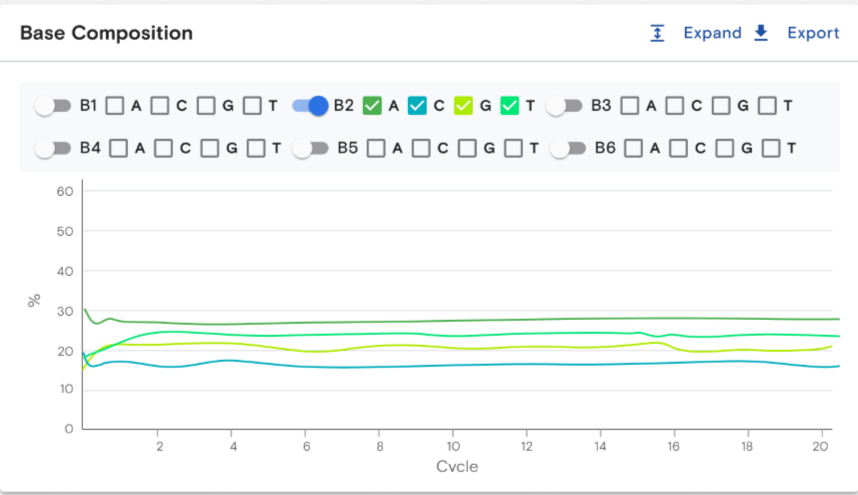
Base Composition
Base composition per cycle, shown by batch. Select a base to visualize its composition individually.
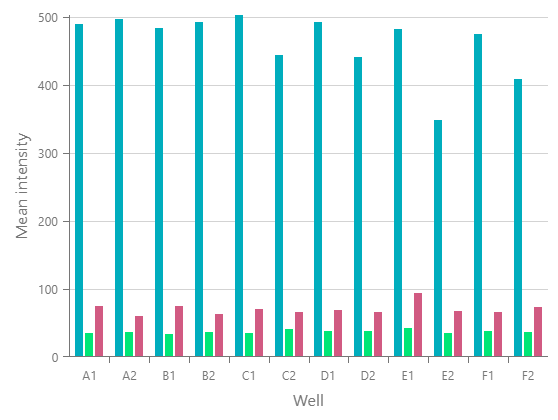
Protein IF
Immunofluorescence signal for each protein target in the panel. Select a protein target from the dropdown to generate its per-well plot. Included when protein detection is added.
To monitor a run in progress from ElemBio Cloud, see Remote run monitoring.